已更新
TA Moving Averages
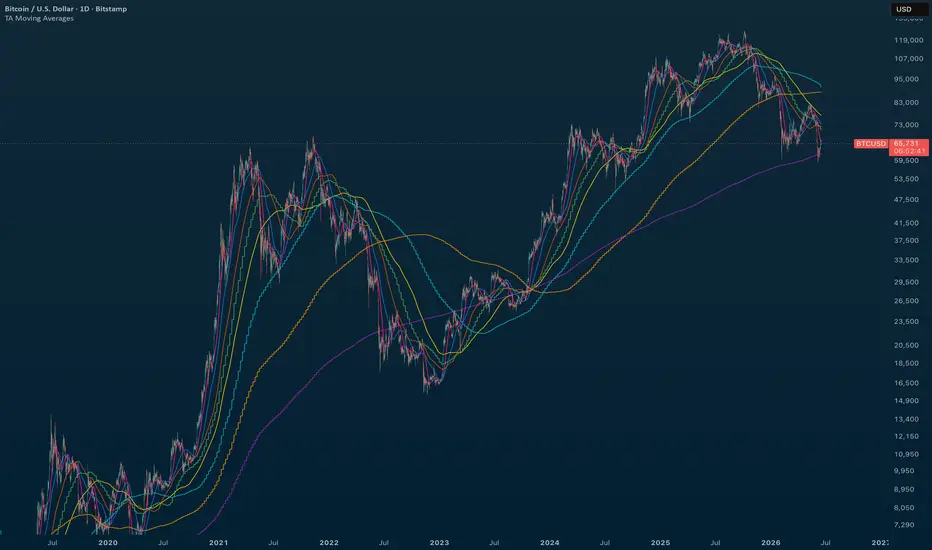
TA Moving Averages
An all-in-one moving average overlay: eight timeframe-anchored MAs (the 20 / 50 / 100 / 200 day and 20 / 50 / 100 / 200 week) plus five fully customizable slots, all on one indicator.
The point of difference is that every predefined MA is calculated with request.security, so it shows the correct daily or weekly value no matter what timeframe your chart is on. The 200-day reads the true daily 200-period SMA whether you are viewing a 5-minute, hourly, daily, or weekly chart. No switching timeframes to check where the big averages sit.
Daily structure
20-Day (bright pink), short-term reference
50-Day (royal blue), common swing reference
100-Day (deep orange), stronger short-term floor
200-Day (yellow), the most-watched long-term trend line across equities and crypto
Weekly structure
20-Week (green), accumulation zone often defended during pullbacks
50-Week (cyan), primary long-term trend filter; above is structural bull, below is structural bear
100-Week (amber), intermediate structural zone for multi-year cycles
200-Week (purple), long-term structural anchor and the classic bull-market floor for crypto
Custom slots
Five extra slots, each with any length, SMA or EMA type, a Chart / Daily / Weekly anchor, and a color picker. Off by default. Enable a 34 EMA, an 89-day Fibonacci reference, a 300-week anchor, or whatever your method calls for.
Built for every style
Day traders lean on the 20D / 50D for intraday support and resistance. Swing traders use the 50D / 100D with the 20W / 50W for cycle structure. Position traders watch the 100W / 200W as long-term anchors. Multi-timeframe analysts see all eight at once.
Notes
All MAs use lookahead off, so there is no repaint risk. Each line has its own toggle and color picker, and values are kept out of the chart legend to keep the title clean (still visible on the price scale and in the Data Window). Works on any timeframe; the weekly MAs reveal structure best on daily and weekly charts.
An all-in-one moving average overlay: eight timeframe-anchored MAs (the 20 / 50 / 100 / 200 day and 20 / 50 / 100 / 200 week) plus five fully customizable slots, all on one indicator.
The point of difference is that every predefined MA is calculated with request.security, so it shows the correct daily or weekly value no matter what timeframe your chart is on. The 200-day reads the true daily 200-period SMA whether you are viewing a 5-minute, hourly, daily, or weekly chart. No switching timeframes to check where the big averages sit.
Daily structure
20-Day (bright pink), short-term reference
50-Day (royal blue), common swing reference
100-Day (deep orange), stronger short-term floor
200-Day (yellow), the most-watched long-term trend line across equities and crypto
Weekly structure
20-Week (green), accumulation zone often defended during pullbacks
50-Week (cyan), primary long-term trend filter; above is structural bull, below is structural bear
100-Week (amber), intermediate structural zone for multi-year cycles
200-Week (purple), long-term structural anchor and the classic bull-market floor for crypto
Custom slots
Five extra slots, each with any length, SMA or EMA type, a Chart / Daily / Weekly anchor, and a color picker. Off by default. Enable a 34 EMA, an 89-day Fibonacci reference, a 300-week anchor, or whatever your method calls for.
Built for every style
Day traders lean on the 20D / 50D for intraday support and resistance. Swing traders use the 50D / 100D with the 20W / 50W for cycle structure. Position traders watch the 100W / 200W as long-term anchors. Multi-timeframe analysts see all eight at once.
Notes
All MAs use lookahead off, so there is no repaint risk. Each line has its own toggle and color picker, and values are kept out of the chart legend to keep the title clean (still visible on the price scale and in the Data Window). Works on any timeframe; the weekly MAs reveal structure best on daily and weekly charts.
發行說明
Updated custom MA defaults:The five customizable moving average slots now start with more commonly used lengths. Slots 1 to 3 default to 12, 22, and 55, slot 4 to a 9 EMA, and slot 5 to a 200 EMA. They are still off by default, so enable the ones you want. The eight built in levels (the 20, 50, 100, and 200 day and week) are unchanged and stay on SMA, the standard for those reference levels.
SMA and EMA explained in settings:
Each custom slot's Type selector now has an info icon that spells out the difference. SMA averages recent closes equally for a smoother, slower line, while EMA weights recent closes more heavily so it reacts faster and turns sooner.
發行說明
Custom MA timeframe tweak:The 12 and 22 custom moving averages now default to the chart timeframe, so they track whatever timeframe you are viewing instead of being pinned to the daily. They are fast flip averages for day and swing traders, so reading them off your current chart is more useful. The 55, 9, and 200 custom slots are unchanged.
發行說明
Performance rebuild:This update is entirely under the hood: every moving average calculates exactly as it did before, and nothing changes visually. The previous build requested data for all thirteen possible lines on every load, even when most were turned off, including the five custom slots that ship disabled. Now the eight fixed daily and weekly averages arrive in two batched data requests instead of eight separate ones, each timeframe is only fetched when at least one of its averages is visible, and a disabled custom slot does no work at all. Loading should feel noticeably snappier, especially on slower symbols and in layouts carrying many indicators.
No settings, values, or visuals changed:
Your saved configurations carry over untouched.
發行說明
Monthly anchor for the custom slots:Each custom slot's TF dropdown now offers M alongside Chart, D and W. Set a slot to EMA, length 20, TF M and you get the true 20-month EMA, computed on monthly bars, on any chart timeframe. Until now the only way to approximate a monthly average was to convert months into days, which is never exact. The info icon on the Type row now explains all four anchors.
Lock the daily set to the chart timeframe:
A new checkbox at the bottom of the Daily Moving Averages section, off by default. When it is on, the 20, 50, 100 and 200 are computed on the chart's own bars instead of daily bars, so on a 15 minute chart you get the 20, 50, 100 and 200 of the 15 minute bars in their usual colors, which is what most intraday traders mean by their moving averages. The weekly set and the custom slots are not affected. One cosmetic note: the Style tab keeps the daily names for these four lines while the lock is on.
About the original description:
The Custom slots paragraph lists a Chart / Daily / Weekly anchor. As of this update the anchor can also be Monthly.
Your saved settings:
The new checkbox is added at the end of the list and the existing dropdown values are unchanged, so saved layouts and templates keep every value you had.
Alerts:
This indicator has no alerts, so there is nothing to recreate.

Invite-only indicators for Trading Apologist Patreon members.
Join at patreon.com/TradingApologist, then submit your TradingView username via the form on Patreon or the portal at tradingapologist.com. Access within 1-2h.
Join at patreon.com/TradingApologist, then submit your TradingView username via the form on Patreon or the portal at tradingapologist.com. Access within 1-2h.
免責聲明
這些資訊和出版物並非旨在提供,也不構成TradingView提供或認可的任何形式的財務、投資、交易或其他類型的建議或推薦。請閱讀使用條款以了解更多資訊。
Invite-only indicators for Trading Apologist Patreon members.
Join at patreon.com/TradingApologist, then submit your TradingView username via the form on Patreon or the portal at tradingapologist.com. Access within 1-2h.
Join at patreon.com/TradingApologist, then submit your TradingView username via the form on Patreon or the portal at tradingapologist.com. Access within 1-2h.
免責聲明
這些資訊和出版物並非旨在提供,也不構成TradingView提供或認可的任何形式的財務、投資、交易或其他類型的建議或推薦。請閱讀使用條款以了解更多資訊。