OPEN-SOURCE SCRIPT
已更新 Customizable Vertical Lines
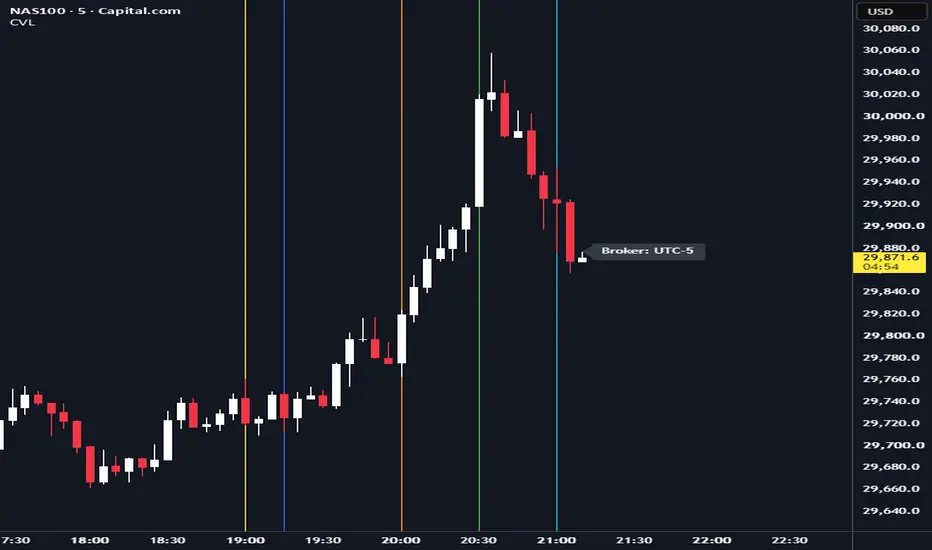
Customizable Vertical Lines (CVL) Indicator
Version 2.0 (November 2023)
Description:
The Customizable Vertical Lines (CVL) indicator is a powerful tool for traders who want to mark specific times on their charts with vertical lines. This indicator allows users to customize the appearance of these lines, including their color, line style, and width, providing a flexible and visually intuitive way to highlight key time points.
Key Features:
User-Friendly Inputs: Easily set up to five distinct times, each associated with a unique color for the vertical lines.
Color Customization: Choose from a wide range of colors for each vertical line, allowing for clear differentiation.
Line Style Options: Tailor the appearance of the lines with three selectable styles: solid, dotted, or dashed.
Adjustable Line Width: Modify the thickness of the lines to suit your preferred visual style.
Timezone Offset: Account for different time zones by adjusting the timezone offset parameter.
How to Use:
Simply input the desired times, colors, and other parameters in the script settings. The CVL indicator will then automatically plot vertical lines at the specified times on the chart with the chosen customization.
Version 2.0 (November 2023)
Description:
The Customizable Vertical Lines (CVL) indicator is a powerful tool for traders who want to mark specific times on their charts with vertical lines. This indicator allows users to customize the appearance of these lines, including their color, line style, and width, providing a flexible and visually intuitive way to highlight key time points.
Key Features:
User-Friendly Inputs: Easily set up to five distinct times, each associated with a unique color for the vertical lines.
Color Customization: Choose from a wide range of colors for each vertical line, allowing for clear differentiation.
Line Style Options: Tailor the appearance of the lines with three selectable styles: solid, dotted, or dashed.
Adjustable Line Width: Modify the thickness of the lines to suit your preferred visual style.
Timezone Offset: Account for different time zones by adjusting the timezone offset parameter.
How to Use:
Simply input the desired times, colors, and other parameters in the script settings. The CVL indicator will then automatically plot vertical lines at the specified times on the chart with the chosen customization.
發行說明
Customizable Vertical Lines (CVL) Indicator: Advanced Time MarkingThe Customizable Vertical Lines (CVL) indicator is a powerful tool for marking specific times on your charts, now featuring enhanced labeling to make your time-based analysis permanent and clean.
發行說明
Added minutes option發行說明
Added Minutes發行說明
Adding setting if there if DST Month since there need to offset the time. 發行說明
Updated short title發行說明
Added Time 7發行說明
Plot vertical time markers locked to your local timezone — no matter which broker or exchange you use. The script auto-detects the broker's timezone and converts your target times correctly.What's New in v6
> Auto-detect broker timezone — no more guessing offset or DST toggles. Set your own GMT and CVL handles the conversion.
> "Show Broker Server Time" toggle — displays the detected exchange offset as a label (Broker: UTC+1) so you always know which timezone your chart is aligned to. Toggle it on/off anytime.
> Clean vertical stems — anchors sit outside the visible price range, so only the vertical line shows — no horizontal dash artifacts cluttering your support/resistance zones.
> Hardened defaults — line style fixed to solid, anchor logic locked. Fewer knobs, cleaner chart.
> Pine Script v6
How to Use
1. Set Target Timezone (GMT) to YOUR local timezone (e.g., 8 for Singapore, -4 for New York).
2. Configure up to 7 time slots with your key hours (session opens, news events, entry windows).
3. Check Show Broker Server Time to verify the detected exchange offset.
4. Lines will fire at those times every day, locked to YOUR clock, on any broker chart.
Use Cases
> Mark session opens (London, New York, Asia) on any instrument
> Highlight news event times (FOMC, NFP, CPI)
> Intraday time-based strategies — entry windows, session close warnings
> Verify chart timezone alignment at a glance
開源腳本
秉持TradingView一貫精神,這個腳本的創作者將其設為開源,以便交易者檢視並驗證其功能。向作者致敬!您可以免費使用此腳本,但請注意,重新發佈代碼需遵守我們的社群規範。

免責聲明
這些資訊和出版物並非旨在提供,也不構成TradingView提供或認可的任何形式的財務、投資、交易或其他類型的建議或推薦。請閱讀使用條款以了解更多資訊。
免責聲明
這些資訊和出版物並非旨在提供,也不構成TradingView提供或認可的任何形式的財務、投資、交易或其他類型的建議或推薦。請閱讀使用條款以了解更多資訊。