RSI Trap [XWiseTrade]
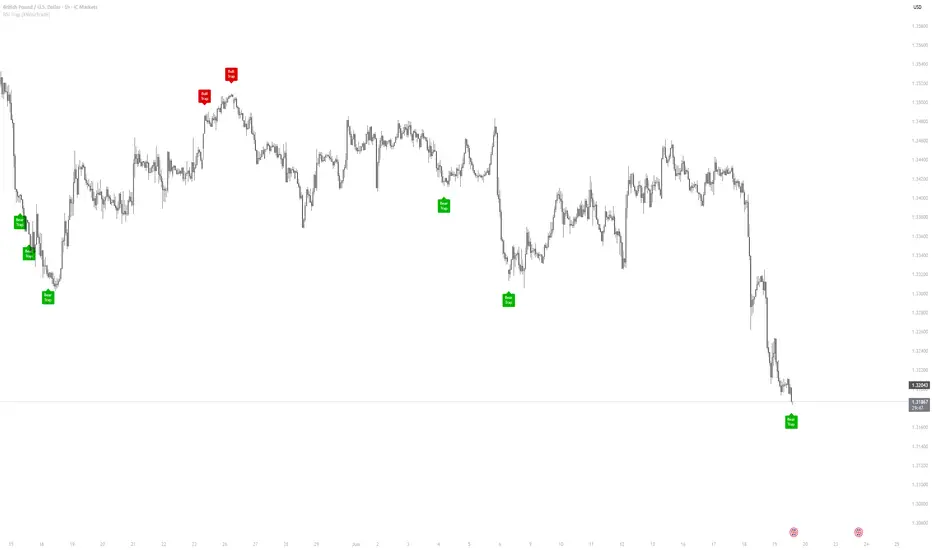
RSI Trap
Most traders read RSI the textbook way: above 70 means overbought, expect a pullback; below 30 means oversold, expect a bounce. RSI Trap is built on the opposite read — and on the one thing the textbook ignores: volume.
The idea
When RSI is overbought and price keeps making new highs, but volume is fading, the conventional trader shorts the "overbought" market. They get trapped. Here's why: if price advances to new highs without volume, there is no one selling into it — no resistance, no defense above. A market that climbs on thin volume isn't exhausted; it's meeting no opposition, and tends to keep going. The trap is sprung on everyone who faded the extreme.
The mirror applies to the downside: oversold, new lows, fading volume — no buyers stepping in, no support below — and the dip-buyers get trapped.
What it shows
Why three conditions, not one
RSI alone fires on every extreme and stays pinned in trends — pure noise.
This requires the extreme to coincide with (a) price still breaking to new highs/lows and (b) contracting volume, isolating the specific case where an "overbought/oversold" reading actually signals continuation rather than reversal.
Inputs
RSI length, overbought/oversold levels, volume average length, low-volume fraction, new-high/low lookback, cooldown.
Built-in alerts both directions. These are descriptive market-structure signals for discretionary use, not buy/sell recommendations.
Most traders read RSI the textbook way: above 70 means overbought, expect a pullback; below 30 means oversold, expect a bounce. RSI Trap is built on the opposite read — and on the one thing the textbook ignores: volume.
The idea
When RSI is overbought and price keeps making new highs, but volume is fading, the conventional trader shorts the "overbought" market. They get trapped. Here's why: if price advances to new highs without volume, there is no one selling into it — no resistance, no defense above. A market that climbs on thin volume isn't exhausted; it's meeting no opposition, and tends to keep going. The trap is sprung on everyone who faded the extreme.
The mirror applies to the downside: oversold, new lows, fading volume — no buyers stepping in, no support below — and the dip-buyers get trapped.
What it shows
- Bull Trap — overbought + new highs + fading volume → no resistance above, uptrend likely continues (traps shorts)
- Bear Trap — oversold + new lows + fading volume → no support below, downtrend likely continues (traps dip-buyers)
- Labels on the candle, with a cooldown to avoid clustering
Why three conditions, not one
RSI alone fires on every extreme and stays pinned in trends — pure noise.
This requires the extreme to coincide with (a) price still breaking to new highs/lows and (b) contracting volume, isolating the specific case where an "overbought/oversold" reading actually signals continuation rather than reversal.
Inputs
RSI length, overbought/oversold levels, volume average length, low-volume fraction, new-high/low lookback, cooldown.
Built-in alerts both directions. These are descriptive market-structure signals for discretionary use, not buy/sell recommendations.

Free tools & education → xwisetrade.com | Community → discord.gg/BUVfRjey2u
免責聲明
這些資訊和出版物並非旨在提供,也不構成TradingView提供或認可的任何形式的財務、投資、交易或其他類型的建議或推薦。請閱讀使用條款以了解更多資訊。
Free tools & education → xwisetrade.com | Community → discord.gg/BUVfRjey2u
免責聲明
這些資訊和出版物並非旨在提供,也不構成TradingView提供或認可的任何形式的財務、投資、交易或其他類型的建議或推薦。請閱讀使用條款以了解更多資訊。