COT Index 3 Timeframes
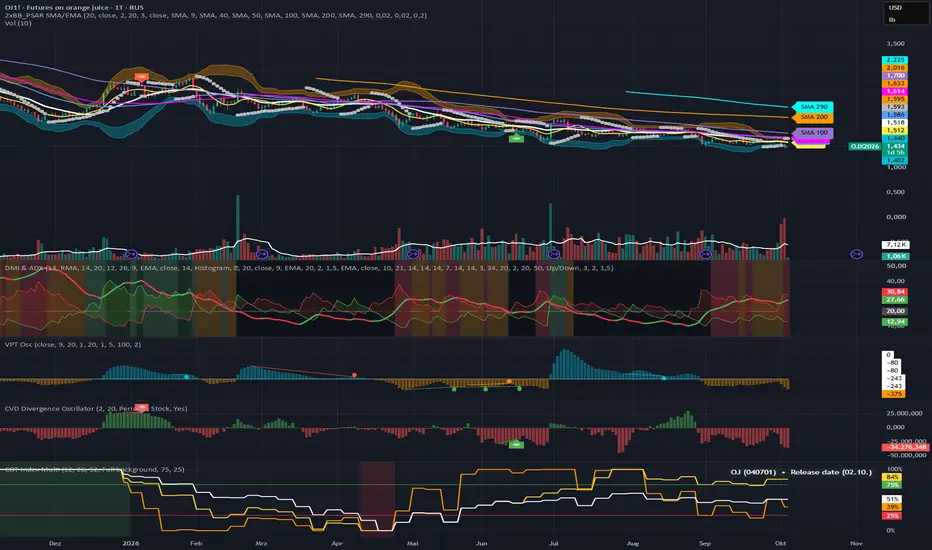
COT Index (Multiple Timeframes) – Follow the Smart Money on Any Chart
OVERVIEW
Every week, the CFTC reveals how the largest players in the futures markets are positioned. Commercials – producers, merchants and large hedgers – deal with the underlying asset every day, and their positioning often turns against the crowd at market extremes.
This indicator turns their net position into a clean 0–100 oscillator – across three lookback periods at once and on any chart timeframe you trade. No more switching to a weekly chart, no more inconsistent values between timeframes.
KEY ADVANTAGES
- Truly timeframe-independent: the lookback counts real weekly COT reports, not chart bars. A 26-week index is always 26 reports – on 1m, 1h, 1D, 1W or 1M.
- Three indices in one pane: short-, medium- and long-term positioning (default 12 / 26 / 52 weeks) side by side. When all three agree, the signal carries real weight.
- Honest history: COT data (as of Tuesday) is published Friday at 15:30 New York time. With "Hide the current week" enabled, each report appears only from its actual release – historical bars show exactly what traders could have known at that moment.
- Smart extreme detection: highlights moments when ALL visible indices reach the upper or lower threshold – as a subtle zone or full background.
- Futures Only or Futures + Options with a single click.
- Built-in symbol corrections for markets like Copper, Lumber, Lithium, Canola, Aluminum and Rough Rice.
- Info panel showing market, CFTC code, data type and release date of the report in use.
HOW TO READ IT
- 100 = Commercials at their most bullish net position of the period
- 0 = Commercials at their most bearish net position of the period
- Above the Upper Threshold (75) = bullish extreme, below the Lower Threshold (25) = bearish extreme
Extreme readings can point to potential turning points. Combine them with your own price-action or timing tools.
SETTINGS
- Number of weeks (Index 1 / 2 / 3): lookback periods in weekly reports (default 12 / 26 / 52).
- Show COT Index 1 / 2 / 3: show or hide each index. Hidden indices are excluded from the extreme marking.
- Include Options: switch between Futures Only and Futures + Options data. Not available for every market.
- Hide the current week (default on): uses a report only after its Friday release. Recommended for realistic analysis. Holiday delays are not considered.
- Mark long and short extremes: highlights bars where all visible indices are beyond the thresholds.
- Extreme marking style: "Zone beyond threshold" (subtle) or "Full background" (maximum visibility).
- Upper / Lower Threshold: levels for the lines, zones and extreme check (default 75 / 25).
NOTES
- Works on all futures markets covered by the CFTC COT report; the CFTC code is detected automatically.
- Uses the Legacy report (Commercial positions); values update once per week.
- "Could not find relevant COT data" means the symbol is not covered, or F+O data is unavailable – try disabling "Include Options".
OVERVIEW
Every week, the CFTC reveals how the largest players in the futures markets are positioned. Commercials – producers, merchants and large hedgers – deal with the underlying asset every day, and their positioning often turns against the crowd at market extremes.
This indicator turns their net position into a clean 0–100 oscillator – across three lookback periods at once and on any chart timeframe you trade. No more switching to a weekly chart, no more inconsistent values between timeframes.
KEY ADVANTAGES
- Truly timeframe-independent: the lookback counts real weekly COT reports, not chart bars. A 26-week index is always 26 reports – on 1m, 1h, 1D, 1W or 1M.
- Three indices in one pane: short-, medium- and long-term positioning (default 12 / 26 / 52 weeks) side by side. When all three agree, the signal carries real weight.
- Honest history: COT data (as of Tuesday) is published Friday at 15:30 New York time. With "Hide the current week" enabled, each report appears only from its actual release – historical bars show exactly what traders could have known at that moment.
- Smart extreme detection: highlights moments when ALL visible indices reach the upper or lower threshold – as a subtle zone or full background.
- Futures Only or Futures + Options with a single click.
- Built-in symbol corrections for markets like Copper, Lumber, Lithium, Canola, Aluminum and Rough Rice.
- Info panel showing market, CFTC code, data type and release date of the report in use.
HOW TO READ IT
- 100 = Commercials at their most bullish net position of the period
- 0 = Commercials at their most bearish net position of the period
- Above the Upper Threshold (75) = bullish extreme, below the Lower Threshold (25) = bearish extreme
Extreme readings can point to potential turning points. Combine them with your own price-action or timing tools.
SETTINGS
- Number of weeks (Index 1 / 2 / 3): lookback periods in weekly reports (default 12 / 26 / 52).
- Show COT Index 1 / 2 / 3: show or hide each index. Hidden indices are excluded from the extreme marking.
- Include Options: switch between Futures Only and Futures + Options data. Not available for every market.
- Hide the current week (default on): uses a report only after its Friday release. Recommended for realistic analysis. Holiday delays are not considered.
- Mark long and short extremes: highlights bars where all visible indices are beyond the thresholds.
- Extreme marking style: "Zone beyond threshold" (subtle) or "Full background" (maximum visibility).
- Upper / Lower Threshold: levels for the lines, zones and extreme check (default 75 / 25).
NOTES
- Works on all futures markets covered by the CFTC COT report; the CFTC code is detected automatically.
- Uses the Legacy report (Commercial positions); values update once per week.
- "Could not find relevant COT data" means the symbol is not covered, or F+O data is unavailable – try disabling "Include Options".

免責聲明
這些資訊和出版物並非旨在提供,也不構成TradingView提供或認可的任何形式的財務、投資、交易或其他類型的建議或推薦。請閱讀使用條款以了解更多資訊。
免責聲明
這些資訊和出版物並非旨在提供,也不構成TradingView提供或認可的任何形式的財務、投資、交易或其他類型的建議或推薦。請閱讀使用條款以了解更多資訊。