已更新
VOL & AVG Overlay
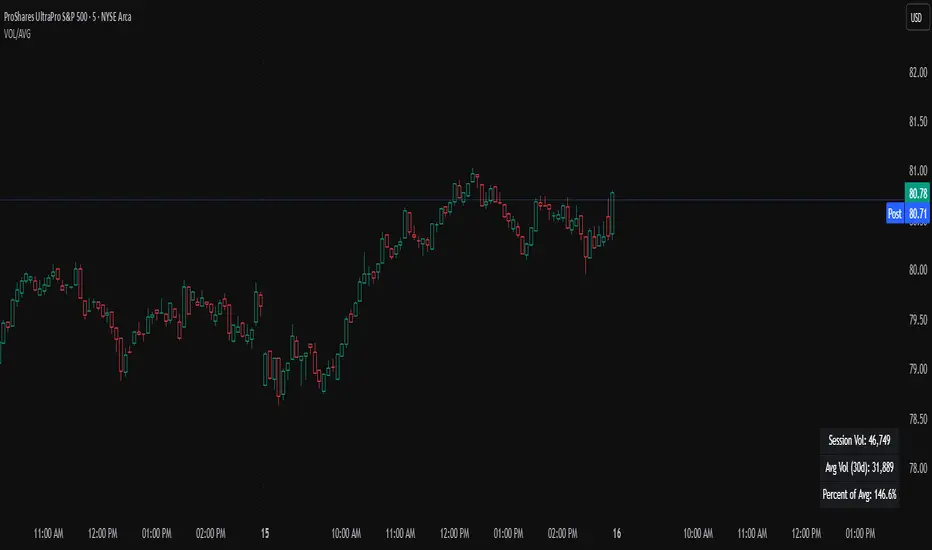
Custom Session Volume Versus Average Volume
Description:
This indicator will create an overlay on your chart that will show you the following information:
Options:
Example:
Set indicator to 30 period average. Set custom time frame to 9:30am to 10:30am Eastern/New York.
When the time frame for the calculation is closed, the indicator will provide a comparison of the current days volume compared to the average of 30 previous days for that same time frame and display it as a percentage in the table.
In this example you could compare how the first hour of the trading day compares to the previous 30 day's average, aiding in evaluating the potential volume for the remainder of the day.
Notes:
If you prefer data in this format as opposed to a plotted line, check out my other indicator: ADR & ATR Overlay
Description:
This indicator will create an overlay on your chart that will show you the following information:
- Custom Session Volume
- Average For Selected Session
- Percentage Comparison
Options:
- Set Custom Time Frame For Calculations
- Set Custom Time Frame For Average Comparison
- Set Custom Time Zone
- Enable / Disable Each Value
- Change Text Color
- Change Background Color
- Change Table location
Example:
Set indicator to 30 period average. Set custom time frame to 9:30am to 10:30am Eastern/New York.
When the time frame for the calculation is closed, the indicator will provide a comparison of the current days volume compared to the average of 30 previous days for that same time frame and display it as a percentage in the table.
In this example you could compare how the first hour of the trading day compares to the previous 30 day's average, aiding in evaluating the potential volume for the remainder of the day.
Notes:
- Times must be entered in 24 hour format. (1pm = 13:00 etc.)
- This indicator is for Intra-day time frames, not > Day.
If you prefer data in this format as opposed to a plotted line, check out my other indicator: ADR & ATR Overlay
發行說明
updated chart example only發行說明
updating chart only發行說明
Added an additional (optional) top row to the table so values aren't covered by Trading Views buttons if placed in top right corner. 發行說明
corrected calculation logic when changing time frame on chart
免責聲明
這些資訊和出版物並非旨在提供,也不構成TradingView提供或認可的任何形式的財務、投資、交易或其他類型的建議或推薦。請閱讀使用條款以了解更多資訊。