OPEN-SOURCE SCRIPT
已更新 Smart Money Pressure Differential
Purpose
The Smart Money Pressure Differential (SMPD) is built to reveal the underlying tug‑of‑war between informed volume flows represented by NVI and reactive volume flows represented by PVI, using a clean statistical framework. Instead of relying on raw NVI or PVI, which drift over time and are not directly comparable, the script isolates pressure deviations by measuring how far each index moves away from its own long‑term expectation. By standardizing these deviations, SMPD produces a stable, volatility‑normalized spread that highlights accumulation, distribution, and regime transitions with far greater clarity than traditional volume indicators.
How It Works
The script computes NVI and PVI, scales them, and subtracts their EMAs to extract deviation‑from‑trend pressure, with optional WMA smoothing to reduce micro‑noise. Each deviation series is then standardized independently using rolling mean and standard deviation, ensuring both NVI and PVI operate on equal statistical footing. Their difference becomes the SMPD spread, a normalized measure of which side is exerting more pressure. A second layer applies log‑ROC to capture acceleration rather than level, and these acceleration signals can be plotted as dotted lines. Standard deviation reference levels at 0, 1, 2, and 3 provide a consistent frame for interpreting extreme pressure events.
Rationale
This architecture solves structural weaknesses found in most volume‑based tools, particularly scale drift, volatility collapse, and the instability of cumulative indicators. Standardizing before differencing prevents one index from overpowering the other, ensuring the spread reflects true pressure imbalance rather than structural bias. The log‑ROC layer adds a stable acceleration measure that avoids the distortions of classic ROC when values approach zero. The result is a regime‑independent engine, producing signals that remain comparable across assets, timeframes, and market conditions. SMPD therefore becomes a robust diagnostic tool for identifying when smart‑money pressure is building, fading, or reversing, without relying on arbitrary thresholds or bounded oscillators that distort signal strength.
The Smart Money Pressure Differential (SMPD) is built to reveal the underlying tug‑of‑war between informed volume flows represented by NVI and reactive volume flows represented by PVI, using a clean statistical framework. Instead of relying on raw NVI or PVI, which drift over time and are not directly comparable, the script isolates pressure deviations by measuring how far each index moves away from its own long‑term expectation. By standardizing these deviations, SMPD produces a stable, volatility‑normalized spread that highlights accumulation, distribution, and regime transitions with far greater clarity than traditional volume indicators.
How It Works
The script computes NVI and PVI, scales them, and subtracts their EMAs to extract deviation‑from‑trend pressure, with optional WMA smoothing to reduce micro‑noise. Each deviation series is then standardized independently using rolling mean and standard deviation, ensuring both NVI and PVI operate on equal statistical footing. Their difference becomes the SMPD spread, a normalized measure of which side is exerting more pressure. A second layer applies log‑ROC to capture acceleration rather than level, and these acceleration signals can be plotted as dotted lines. Standard deviation reference levels at 0, 1, 2, and 3 provide a consistent frame for interpreting extreme pressure events.
Rationale
This architecture solves structural weaknesses found in most volume‑based tools, particularly scale drift, volatility collapse, and the instability of cumulative indicators. Standardizing before differencing prevents one index from overpowering the other, ensuring the spread reflects true pressure imbalance rather than structural bias. The log‑ROC layer adds a stable acceleration measure that avoids the distortions of classic ROC when values approach zero. The result is a regime‑independent engine, producing signals that remain comparable across assets, timeframes, and market conditions. SMPD therefore becomes a robust diagnostic tool for identifying when smart‑money pressure is building, fading, or reversing, without relying on arbitrary thresholds or bounded oscillators that distort signal strength.
發行說明
- Removed the smoothing that was weakening the true displacement and acceleration signals by blurring the inputs before ROC was calculated. Now ROC is computed on clean, raw standardized differences, and any smoothing happens only afterward as a cosmetic layer, preserving the full integrity of SMPD’s physics.發行說明
- Applied the classical ROC formula since smoothing solved the explosive behaviour and there's no need for alternative ROC on the raw values發行說明
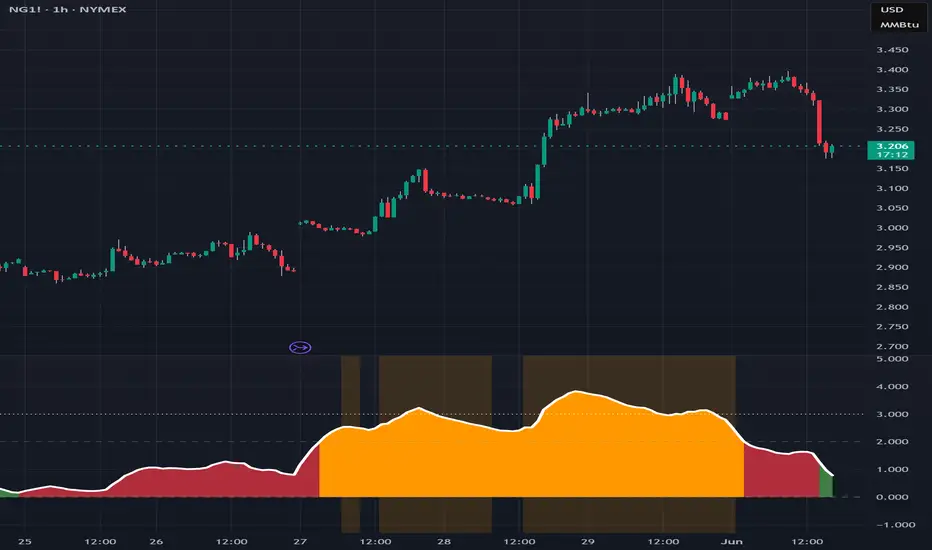
Update:- Enhanced buyer behavior visualization: The indicator now differentiates between Aggressive (Red) and Passive (Bright Green) buying activity.
- Passive Absorption: High green activity at price lows suggests limit-order absorption, marking potential support or "bottoming" zones.
- Aggressive Momentum: High red activity during breakouts indicates aggressive market orders; use this to avoid early short entries and prevent premature liquidation.
Disclaimer: These signals identify high-probability zones for confluence, not guaranteed reversal points. This is not a trend indicator. It isolates the active participant profile during price action.
開源腳本
秉持TradingView一貫精神,這個腳本的創作者將其設為開源,以便交易者檢視並驗證其功能。向作者致敬!您可以免費使用此腳本,但請注意,重新發佈代碼需遵守我們的社群規範。

免責聲明
這些資訊和出版物並非旨在提供,也不構成TradingView提供或認可的任何形式的財務、投資、交易或其他類型的建議或推薦。請閱讀使用條款以了解更多資訊。
開源腳本
秉持TradingView一貫精神,這個腳本的創作者將其設為開源,以便交易者檢視並驗證其功能。向作者致敬!您可以免費使用此腳本,但請注意,重新發佈代碼需遵守我們的社群規範。
免責聲明
這些資訊和出版物並非旨在提供,也不構成TradingView提供或認可的任何形式的財務、投資、交易或其他類型的建議或推薦。請閱讀使用條款以了解更多資訊。