OPEN-SOURCE SCRIPT
已更新 BTC Top, Mid and Bottom Cap Bands [jcray]
Modified from ETH Top, Mid and Bottom Cap Bands [jcray] (private as of publishing, to be made public in a month), which in turn was modified from Average Cap and Top Cap by aamonkey.
NB: only use this indicator with the YTD timeframe.
The Top Cap and Bottom Cap uses the same formula as the Top Cap and Average Cap by aamonkey.
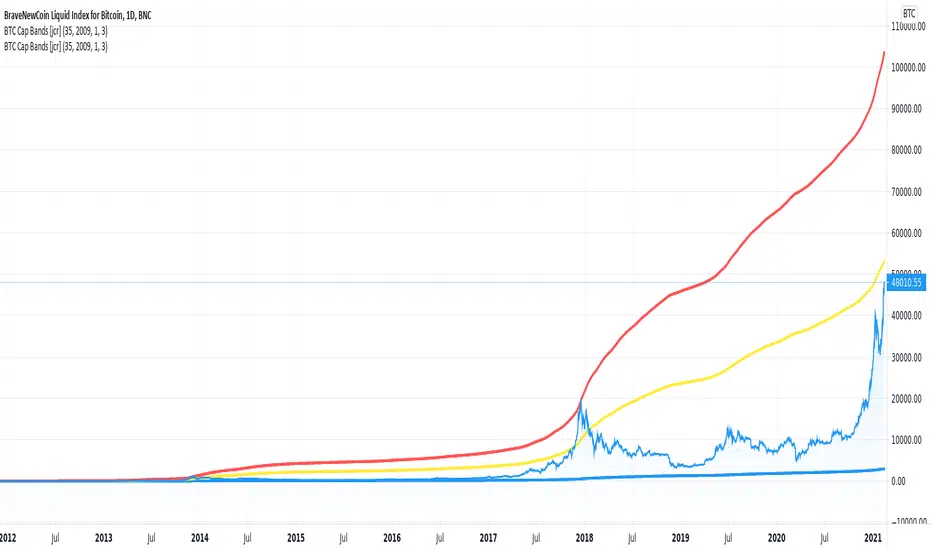
The Top Cap (red line) can be seen as an absolute market top that may never be significantly exceeded and so is a good indicator to sell a position, or enter a long-term short-sell.
The "Mid Cap" (yellow line) can be used as an indicator for market sentiment. It is calculated as the average of the Top Cap and Bottom Cap. Above the mid cap, the market is in a bullish environment, and below it, the market is in a bearish environment. Note that the cryptocurrency may be in a bull run while in a bearish environment, and conversely it may be experiencing a correction or reversal in a bullish environment.
The "Bottom Cap" (blue line) can be seen as an absolute market bottom that may never be fallen short of, and so is a good indicator to enter a long-term buying opportunity, or exit a long-term short-sell.
See also my other scripts:
- as mentioned, ETH Top, Mid and Bottom Cap Bands [jcray] bit ly ethcaps
- Holo/HOT Top, Mid and Bottom Caps / Cap Bands [jcray] bit ly hottcmc
- Uni Top Cap
From Average Cap by aamonkey:
----
This is the "forever" moving average of the Market Cap.
The cumulative sum of the daily Market Cap values divided by the age of the market in days.
Can be seen as an ultimate bottom that should never be touched and if so is a good buying opportunity.
The default settings are for BTC .
If you want to test this indicator on another chart you have to change the launch date settings (and maybe play around with the multiplier).
Some Interesting Launch dates:
- BTC: 3 JAN 2009
- ETH: 30. JUL 2015
- LTC: 7. OCT 2011
This indicator is also the base for other indicators like my "Top Cap" indicator.
----
From Top Cap by aamonkey:
----
Historically matched market tops for BTC .
It's the Average Cap (see my other indicator) multiplied by 35.
The default settings are for BTC .
If you want to test this indicator on another chart you have to change the launch date settings (and maybe play around with the multiplier).
Some Interesting Launch dates:
- BTC: 3 JAN 2009
- ETH: 30. JUL 2015
- LTC: 7. OCT 2011
----
NB: only use this indicator with the YTD timeframe.
The Top Cap and Bottom Cap uses the same formula as the Top Cap and Average Cap by aamonkey.
The Top Cap (red line) can be seen as an absolute market top that may never be significantly exceeded and so is a good indicator to sell a position, or enter a long-term short-sell.
The "Mid Cap" (yellow line) can be used as an indicator for market sentiment. It is calculated as the average of the Top Cap and Bottom Cap. Above the mid cap, the market is in a bullish environment, and below it, the market is in a bearish environment. Note that the cryptocurrency may be in a bull run while in a bearish environment, and conversely it may be experiencing a correction or reversal in a bullish environment.
The "Bottom Cap" (blue line) can be seen as an absolute market bottom that may never be fallen short of, and so is a good indicator to enter a long-term buying opportunity, or exit a long-term short-sell.
See also my other scripts:
- as mentioned, ETH Top, Mid and Bottom Cap Bands [jcray] bit ly ethcaps
- Holo/HOT Top, Mid and Bottom Caps / Cap Bands [jcray] bit ly hottcmc
- Uni Top Cap
From Average Cap by aamonkey:
----
This is the "forever" moving average of the Market Cap.
The cumulative sum of the daily Market Cap values divided by the age of the market in days.
Can be seen as an ultimate bottom that should never be touched and if so is a good buying opportunity.
The default settings are for BTC .
If you want to test this indicator on another chart you have to change the launch date settings (and maybe play around with the multiplier).
Some Interesting Launch dates:
- BTC: 3 JAN 2009
- ETH: 30. JUL 2015
- LTC: 7. OCT 2011
This indicator is also the base for other indicators like my "Top Cap" indicator.
----
From Top Cap by aamonkey:
----
Historically matched market tops for BTC .
It's the Average Cap (see my other indicator) multiplied by 35.
The default settings are for BTC .
If you want to test this indicator on another chart you have to change the launch date settings (and maybe play around with the multiplier).
Some Interesting Launch dates:
- BTC: 3 JAN 2009
- ETH: 30. JUL 2015
- LTC: 7. OCT 2011
----
發行說明
Removes Bottom Multiplier input開源腳本
秉持TradingView一貫精神,這個腳本的創作者將其設為開源,以便交易者檢視並驗證其功能。向作者致敬!您可以免費使用此腳本,但請注意,重新發佈代碼需遵守我們的社群規範。

免責聲明
這些資訊和出版物並非旨在提供,也不構成TradingView提供或認可的任何形式的財務、投資、交易或其他類型的建議或推薦。請閱讀使用條款以了解更多資訊。
免責聲明
這些資訊和出版物並非旨在提供,也不構成TradingView提供或認可的任何形式的財務、投資、交易或其他類型的建議或推薦。請閱讀使用條款以了解更多資訊。