OPEN-SOURCE SCRIPT
已更新 RSI Return Study
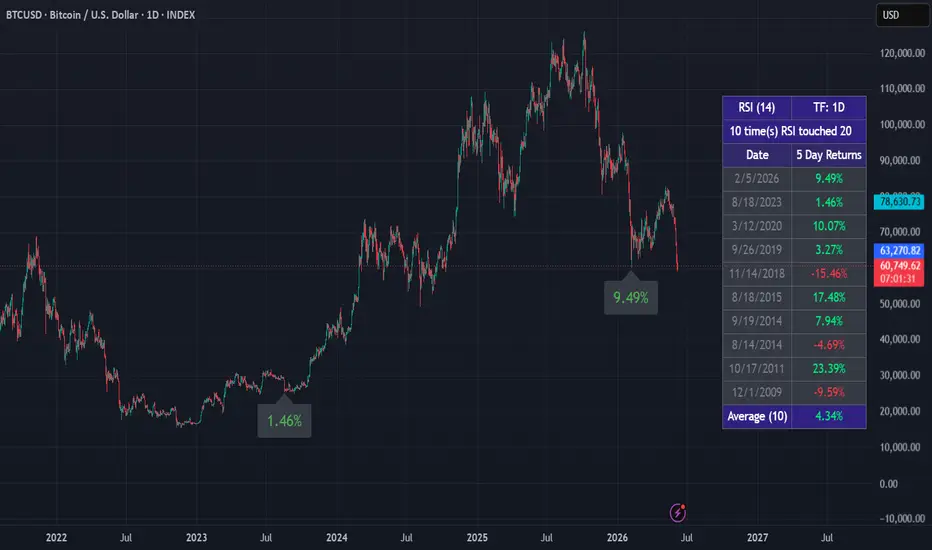
Ever wonder what happens after the RSI hits an extreme level on your favorite ticker? This indicator answers that question historically.
What it does:
How to use:
Notes:
What it does:
- Finds every instance where the RSI crossed a user-defined trigger level
- Measures the forward price return N trading days later
- Displays each signal date and return in a clean table
- Plots labels on the chart at each signal location
- Shows the average return across all historical signals
How to use:
- Set "When RSI Touches..." to your oversold level (e.g. 25) or overbought level (e.g. 75)
- Set "Calculate Return Days Later" to how many trading days forward you want to measure
- Works on any timeframe — bar count is automatically calculated for you
- Adjust "Max Results/Labels to Display" to control how much shows on the chart
Notes:
- All signals are included in the average regardless of the display limit
- Set "Min Bars Between Signals" to 0 to count every RSI cross, or increase it to reduce clustering during volatile periods
發行說明
Added the ability to see more than one forward return. For example, can now input"1D,3D,7D" or
"5D,1M,3M,6M,1Y"
Can support up to 5 forward returns.
開源腳本
秉持TradingView一貫精神,這個腳本的創作者將其設為開源,以便交易者檢視並驗證其功能。向作者致敬!您可以免費使用此腳本,但請注意,重新發佈代碼需遵守我們的社群規範。

免責聲明
這些資訊和出版物並非旨在提供,也不構成TradingView提供或認可的任何形式的財務、投資、交易或其他類型的建議或推薦。請閱讀使用條款以了解更多資訊。
開源腳本
秉持TradingView一貫精神,這個腳本的創作者將其設為開源,以便交易者檢視並驗證其功能。向作者致敬!您可以免費使用此腳本,但請注意,重新發佈代碼需遵守我們的社群規範。
免責聲明
這些資訊和出版物並非旨在提供,也不構成TradingView提供或認可的任何形式的財務、投資、交易或其他類型的建議或推薦。請閱讀使用條款以了解更多資訊。