OPEN-SOURCE SCRIPT
已更新 Global Sessions & Kill Zones [jpkxyz]
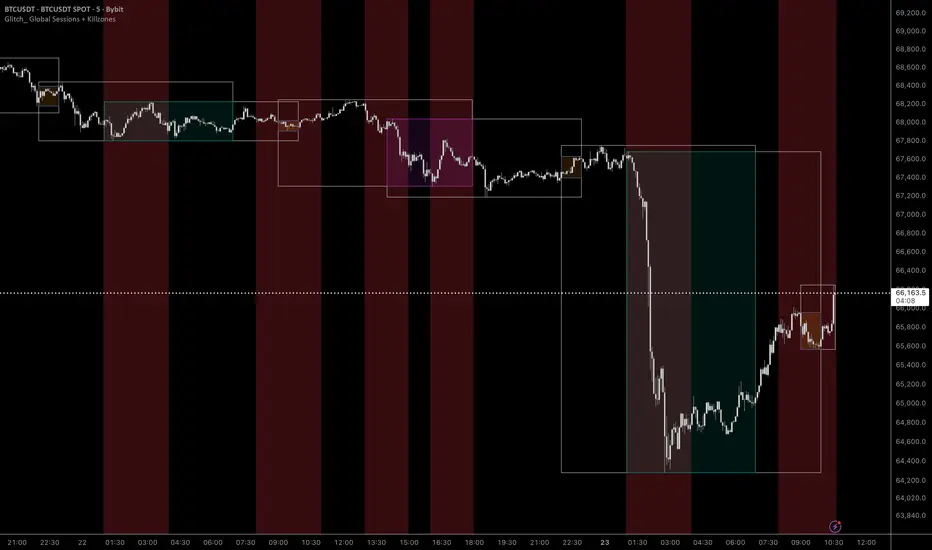
Global Sessions & ICT Kill Zones Indicator
Overview
The Global Sessions & ICT Kill Zones indicator is a comprehensive trading tool designed to help traders identify and visualize the most critical time periods in the 24-hour forex and futures markets. This indicator combines traditional trading session analysis with Inner Circle Trader (ICT) Kill Zone methodology, providing traders with a complete picture of when institutional activity and liquidity are at their peak.
Trading Theory & Foundation
Session-Based Trading
The forex market operates 24 hours a day across four major trading sessions: Sydney, Tokyo, London, and New York. Each session has distinct characteristics in terms of volatility, liquidity, and price behavior. Understanding these sessions is crucial because:
ICT Kill Zones
The Inner Circle Trader (ICT) methodology emphasizes specific time windows called "Kill Zones" - periods when institutional algorithms and smart money are most active. These time windows represent optimal trading opportunities because:
The four ICT Kill Zones are:
What This Indicator Visualizes
Trading Session Boxes
The indicator draws high-to-low range boxes for each major trading session:
Each session box displays:
Session Overlaps
The indicator automatically identifies and highlights all session overlaps with distinct colored boxes:
These overlaps are crucial because they represent periods of increased liquidity when multiple major markets are operating simultaneously, often leading to significant price movements and breakouts.
ICT Kill Zones
Kill Zones are displayed as vertical background highlights that span the entire chart height during their active periods:
How Traders Can Use This Indicator
Entry Timing
Support & Resistance
Risk Management
Strategy Development
Full Customizability
Session Customization
Every aspect of each trading session can be customized:
Kill Zone Customization
Complete control over ICT Kill Zone display:
Visual Preferences
Overlap Customization
All four session overlaps have independent color controls:
Technical Features
Midnight Handling
The indicator uses advanced hour-based detection that seamlessly handles sessions crossing midnight (like Sydney's 21:00-06:00 UTC timeframe) without breaking the visualization into separate boxes.
Real-Time Updates
Clean Chart Integration
Ideal For
Best Practices
Conclusion
The Global Sessions & ICT Kill Zones indicator provides traders with institutional-grade time-based analysis in a highly customizable, visually clear format. By combining traditional session analysis with modern ICT Kill Zone theory, traders gain a comprehensive understanding of when markets are most likely to move and where key levels are established. Whether you're a scalper looking for the highest liquidity periods or a swing trader using session levels for support/resistance, this indicator adapts to your needs while keeping your charts clean and professional.
Trade smarter by trading when the market is most active and predictable.
Overview
The Global Sessions & ICT Kill Zones indicator is a comprehensive trading tool designed to help traders identify and visualize the most critical time periods in the 24-hour forex and futures markets. This indicator combines traditional trading session analysis with Inner Circle Trader (ICT) Kill Zone methodology, providing traders with a complete picture of when institutional activity and liquidity are at their peak.
Trading Theory & Foundation
Session-Based Trading
The forex market operates 24 hours a day across four major trading sessions: Sydney, Tokyo, London, and New York. Each session has distinct characteristics in terms of volatility, liquidity, and price behavior. Understanding these sessions is crucial because:
- Volatility Patterns: Each session exhibits unique volatility profiles based on which markets are open and which institutional players are active
- Liquidity Concentration: Major price movements tend to occur when multiple sessions overlap, as more market participants are active simultaneously
- Market Structure: Session highs and lows often act as key support and resistance levels that price respects throughout the trading day
- Time-Based Strategies: Many professional traders structure their strategies around specific sessions that align with their preferred instruments and trading style
ICT Kill Zones
The Inner Circle Trader (ICT) methodology emphasizes specific time windows called "Kill Zones" - periods when institutional algorithms and smart money are most active. These time windows represent optimal trading opportunities because:
- Institutional Activity: Banks, hedge funds, and large institutions execute their orders during these predictable time windows
- Algorithmic Trading: Many institutional algorithms are programmed to operate during these specific periods
- Liquidity Sweeps: Kill Zones often feature stop hunts and liquidity grabs before directional moves
- Higher Probability Setups: Price is more likely to respect technical levels and follow through on setups during these periods
The four ICT Kill Zones are:
- Asian Kill Zone (00:00-03:00 UTC): Early Asian session institutional activity
- London Kill Zone (07:00-10:00 UTC): London open and European institutional entry
- New York Kill Zone (12:00-14:00 UTC): New York open and North American institutional entry
- London Close Kill Zone (15:00-17:00 UTC): European session close and position squaring
What This Indicator Visualizes
Trading Session Boxes
The indicator draws high-to-low range boxes for each major trading session:
- Sydney Session (21:00-06:00 UTC): Captures the Australian and early Asian trading activity
- Tokyo Session (00:00-09:00 UTC): Represents the main Asian trading period
- London Session (08:00-17:00 UTC): Covers the European trading hours
- New York Session (13:00-22:00 UTC): Encompasses North American trading activity
Each session box displays:
- The session's high and low price levels
- Customizable colored borders and fills
- Labels showing the exact high and low values
- Real-time updates as price moves within the active session
Session Overlaps
The indicator automatically identifies and highlights all session overlaps with distinct colored boxes:
- Sydney/Tokyo Overlap: Asian liquidity concentration
- Tokyo/London Overlap: Asian-European transition period
- London/New York Overlap: The most volatile period with maximum liquidity
- Sydney/New York Overlap: Late US session into early Asian session
These overlaps are crucial because they represent periods of increased liquidity when multiple major markets are operating simultaneously, often leading to significant price movements and breakouts.
ICT Kill Zones
Kill Zones are displayed as vertical background highlights that span the entire chart height during their active periods:
- Visual clarity: Semi-transparent colored backgrounds that don't obstruct price action
- Label identification: Each Kill Zone is labeled at its start for easy recognition
- Overlay capability: Kill Zones overlay on top of session boxes, allowing you to see both simultaneously
- Independent control: Each Kill Zone can be toggled on/off individually
How Traders Can Use This Indicator
Entry Timing
- Wait for Kill Zones: Use Kill Zones as your primary trading windows to increase the probability of institutional support for your trades
- Session Boundaries: Look for breakouts or reversals at session open/close times when new participants enter the market
- Overlap Periods: Focus on high-conviction setups during session overlaps when liquidity is highest
Support & Resistance
- Session Highs/Lows: Previous session highs and lows often act as key support/resistance levels
- Sweep Setups: Watch for price to sweep session highs/lows during Kill Zones, then reverse (liquidity grab)
- Range Trading: Trade within session ranges during low-volatility periods, breakout during overlaps
Risk Management
- Volatility Awareness: Adjust position sizing based on which session is active (London/NY overlap = highest volatility)
- Stop Placement: Position stops outside of key session levels to avoid being caught in normal intraday ranges
- Time-Based Exits: Consider exiting or tightening stops as sessions close and liquidity decreases
Strategy Development
- Session-Specific Strategies: Develop different approaches for different sessions based on your instrument's behavior
- Kill Zone Confirmation: Require setups to occur within Kill Zones for higher probability trades
- Backtesting Framework: Use historical session and Kill Zone data to backtest time-based strategies
Full Customizability
Session Customization
Every aspect of each trading session can be customized:
- Toggle Visibility: Show/hide any session independently
- Time Adjustment: Modify start and end hours to match your broker's server time or personal preference
- Color Schemes: Customize box colors and border colors for each session
- Transparency: Adjust fill transparency to see price action clearly while maintaining visual reference
Kill Zone Customization
Complete control over ICT Kill Zone display:
- Individual Toggles: Enable or disable each Kill Zone independently based on your trading style
- Color Selection: Choose distinct colors for each Kill Zone (default: Green, Blue, Yellow, Red)
- Transparency Control: All Kill Zones use 70% transparency by default, fully customizable
- Label Display: Toggle Kill Zone labels on/off via the main label settings
Visual Preferences
- Border Control: Toggle session box borders on/off for cleaner charts
- Label Size: Choose from tiny, small, normal, large, huge, or auto-sizing for all labels
- Label Colors: Customize label background and text colors to match your chart theme
- Box Transparency: Set individual transparency levels for each session and overlap
Overlap Customization
All four session overlaps have independent color controls:
- Sydney/Tokyo Overlap
- Tokyo/London Overlap
- London/New York Overlap
- Sydney/New York Overlap
Technical Features
Midnight Handling
The indicator uses advanced hour-based detection that seamlessly handles sessions crossing midnight (like Sydney's 21:00-06:00 UTC timeframe) without breaking the visualization into separate boxes.
Real-Time Updates
- Active Sessions: Boxes extend and update in real-time as price moves during active sessions
- High/Low Tracking: Session highs and lows are continuously updated until the session closes
- Kill Zone Detection: Background colors appear/disappear precisely at Kill Zone boundaries
Clean Chart Integration
- Minimal Clutter: Only shows active and recently completed sessions
- Overlay Friendly: Works seamlessly with other indicators and doesn't obstruct price action
- Performance Optimized: Efficient code that doesn't slow down chart rendering
Ideal For
- Forex Traders: Track the four major forex sessions and plan trades around overlaps
- Futures Traders: Identify when specific futures markets have peak activity
- ICT Students: Implement Inner Circle Trader concepts with visual Kill Zone references
- Session Traders: Build strategies around specific session characteristics
- Scalpers & Day Traders: Focus on high-liquidity periods for tighter spreads and better fills
- Swing Traders: Use session levels as key support/resistance for multi-day trades
Best Practices
- Start Simple: Enable only the sessions and Kill Zones relevant to your instruments
- Color Code Strategically: Use colors that stand out on your chart theme but don't overwhelm
- Combine with Price Action: Use session levels and Kill Zones as context, not as standalone signals
- Match Your Timezone: Adjust session times if your broker uses non-UTC server time
- Focus on Overlaps: Pay special attention to London/New York overlap for highest-probability setups
- Journal Performance: Track which sessions and Kill Zones work best for your strategy
Conclusion
The Global Sessions & ICT Kill Zones indicator provides traders with institutional-grade time-based analysis in a highly customizable, visually clear format. By combining traditional session analysis with modern ICT Kill Zone theory, traders gain a comprehensive understanding of when markets are most likely to move and where key levels are established. Whether you're a scalper looking for the highest liquidity periods or a swing trader using session levels for support/resistance, this indicator adapts to your needs while keeping your charts clean and professional.
Trade smarter by trading when the market is most active and predictable.
發行說明
Minor Update開源腳本
秉持TradingView一貫精神,這個腳本的創作者將其設為開源,以便交易者檢視並驗證其功能。向作者致敬!您可以免費使用此腳本,但請注意,重新發佈代碼需遵守我們的社群規範。

免責聲明
這些資訊和出版物並非旨在提供,也不構成TradingView提供或認可的任何形式的財務、投資、交易或其他類型的建議或推薦。請閱讀使用條款以了解更多資訊。
開源腳本
秉持TradingView一貫精神,這個腳本的創作者將其設為開源,以便交易者檢視並驗證其功能。向作者致敬!您可以免費使用此腳本,但請注意,重新發佈代碼需遵守我們的社群規範。
免責聲明
這些資訊和出版物並非旨在提供,也不構成TradingView提供或認可的任何形式的財務、投資、交易或其他類型的建議或推薦。請閱讀使用條款以了解更多資訊。