OPEN-SOURCE SCRIPT
已更新 SOXL Swing Signals v8.11
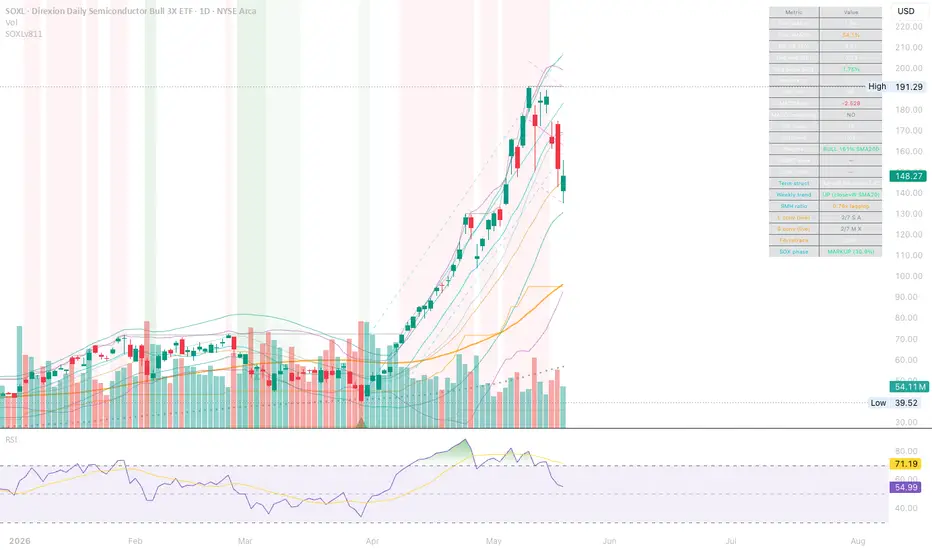
SOXL Swing Signals v8.11 — Long-side primary, opt-in shorts
A multi-tier signal indicator excusively for SOXL (Direxion 3x semiconductor bull ETF), coded by Claude Opus 4.7 AI.
It identifies high-conviction swing entries based on a combination of price action, momentum, volatility, and underlying-index context.
⚠ Important disclaimers
This indicator does not constitute financial advice. It is an analytical tool designed to surface specific technical setups; it does not account for your individual financial situation, risk tolerance, tax circumstances, or trading goals.
Do not use this indicator mechanically as a trading strategy. Signals are intended to provide useful context to support discretionary trading decisions, not to be acted on without independent judgement. Past performance metrics shown below come from historical backtesting and are not predictive of future results. Always combine signals with your own analysis of broader market conditions, risk management, and position sizing.
SOXL is a 3x leveraged ETF with significant decay risk. It is not suitable for buy-and-hold investing, and even short-term positions carry substantial risk of loss exceeding the underlying index's move.
What the indicator does in plain language
The indicator scans every trading day for combinations of conditions that have historically preceded notable price moves on SOXL. When enough conditions align, it draws a green ▲ triangle below price for a long entry suggestion, or a red ▼ triangle above price for a short entry suggestion. Each signal includes a small label showing which "tier" fired (the type of setup) and a star rating (1 to 7 stars) indicating how many supporting conditions were present at the same time.
The indicator also draws regression channels and Bollinger bands on the chart, plus a dashboard table in the top-right corner showing current values for the key metrics it tracks. Coloured warning zones in the background flag periods where price has reached extreme levels relative to its recent range.
Long signals — reasonably reliable
Long entries fire when SOXL appears oversold and ready to bounce. The indicator looks at seven different "tiers" of long setup, ranging from deep capitulation (price collapsing on high volatility, broad index also weak) to subtle pullbacks within an uptrend. By default, the indicator only fires long signals when at least 3 of 7 supporting conditions are present (the "conviction filter").
Historical performance with conviction filter (10 years of SOXL data, 2016 to 2026):
- About 25 long signals over that period (roughly 2 to 4 per year)
- Profit factor approximately 3 to 4 in-sample (total winning return divided by total losing return)
- Win rate around 65 to 70 percent for a 14-day hold
- Walk-forward validation profit factor of 2.28 — meaningfully, the validation period performed BETTER than the training period, which is a strong indicator of genuine edge rather than overfitting
Realistic live expectations: profit factor 2.0 to 2.5 after typical out-of-sample shrinkage, with about 3 to 4 fires per year. The strongest tier (T7 "waterfall") catches genuine semiconductor cycle bottoms — examples include the 2020 COVID low, the 2022 chip-cycle bottom, and the April 2025 tariff-reversal low.
Short signals — very unreliable, opt-in only
This is important: the short side is significantly weaker than the long side and should be treated with extra caution. SOXL spends most of its time in upward-trending semiconductor bull cycles, and shorting against that trend is inherently lower-probability. Through extensive testing, the original "exhaustion-based" short tiers (predicting tops) showed negative expectancy in live conditions and have been disabled by default.
Two opt-in short architectures are available, both turned off by default:
ST9 "bear-cycle" short (turn on via "Enable ST9 bear-cycle shorts" in settings)
- Only fires when the underlying SOX index is in a confirmed bear regime (200-day moving average declining)
- Waits for breakdown confirmation (price below 50-day average, new 20-day low) rather than trying to predict tops
- 7-day intended hold
- Historical: 8 fires over 10 years, profit factor 3.61 in-sample, but 6 of the 8 wins came from a single 6-month window in 2022. Live profit factor likely shrinks to 2.0 to 3.0.
- Recommendation: only enable when you've independently identified a bear cycle starting
ST10 "top-fade" short (turn on via "Enable ST10 top-fade shorts" in settings)
- Fires at single-day exhaustion patterns: upper Bollinger band touch, overbought stochastic, deeply extended above 20-day average, AND price stalls (closes below previous close on a small-change day)
- 3-day intended hold
- Historical: 17 fires over 10 years, profit factor 6.45 in-sample. Holds above 5.0 in every walk-forward split tested.
- Recommendation: enable when comfortable with discretionary top-fade trading. Hold strictly 3 days.
Honest caveats on shorts:
- Both short architectures have small historical sample sizes (8 and 17 fires respectively)
- Both have large performance variance — a few outlier wins inflate the headline numbers
- Short edges in leveraged-ETF land are genuinely fragile and asset-specific. The same architectures we tested on TQQQ and TNA produced losing results despite working on SOXL.
- Treat any individual short signal as a hypothesis to investigate, not a trade to execute mechanically
How the moving parts come together
The indicator runs through this logic each day:
1. Calculate base technicals: SMAs (20, 50, 200), Bollinger bands, stochastic, MACD, RSI, regression channels, and distance-from-mean metrics
2. Pull external context: VIX (volatility index) for the broad market, plus SMH (1x semi ETF) for divergence checking and SOX index for Wyckoff phase classification
3. Check tier conditions: each of the 7 long tiers and 2-5 short tiers has its own combination of thresholds; the indicator evaluates all of them
4. Compute conviction score: 7 supporting factors are checked (volatility panic, oversold bands, MACD direction, vol level, slope/extension, anchored regression position, Fibonacci levels for longs; symmetric set for shorts). Each contributing factor adds 1 to the conviction score (max 7)
5. Apply hard gates: long signals only fire if conviction is at least 3 (default). Short signals only fire if their respective opt-in toggle is enabled
6. Apply cooldown: at most one signal of each type per 8 trading days, to prevent clustering
7. Draw the signal: triangle, label, and details on the chart, plus alert-eligible event for TradingView notifications
The dashboard table in the corner of the chart shows current values of all the key inputs (distance from moving averages, stochastic, RSI, MACD, VIX, regime classification, Wyckoff phase) so you can see exactly why a signal is or isn't firing right now.
Suggested usage
- Use long signals as candidates for swing entries, not automatic buys. Verify against your broader market view, sector context, and risk parameters
- Combine with options for leveraged exposure: 45 to 90 days to expiration, slightly out-of-the-money or at-the-money calls. Avoid weekly options — moves typically play out over 2 to 3 weeks
- Track real-world signal performance for your own use. After 5 to 10 actual trades, you'll have personal evidence of how the indicator behaves in your trading approach
- For shorts: leave both toggles off until you have a specific reason to expect a downturn. When you do enable, use long-dated puts (45 to 90 days) and exit on the indicator's intended hold horizon regardless of where the trade is
Settings worth knowing
- Min conviction for LONG signal (default 3): higher values produce fewer but higher-quality signals
- Enable SHORT signals (default off): controls the original ST1/ST_VIX exhaustion shorts — kept disabled because they showed negative expectancy
- Enable ST9 bear-cycle shorts (default off): trend-following shorts during confirmed bear regimes
- Enable ST10 top-fade shorts (default off): single-day reversal shorts at extended tops
- Show warning zones: background tinting for extreme zones (informational only)
- All thresholds for each tier are individually adjustable in the settings, but the defaults represent the validated configuration
Version history
- v8.11: adds ST10 top-fade short tier with 3-day hold (PF=6.45 in-sample)
- v8.10: adds ST9 bear-cycle short tier with 7-day hold (PF=3.61 in-sample)
- v8.9: introduces conviction-3 hard gate on longs, disables broken short architectures by default
- v8.6 and earlier: development versions, not recommended
This indicator has been designed to work exclusively with SOXL. It has been built with extensive walk-forward validation, evaluator bug correction, and cross-asset testing against TQQQ and TNA equivalents.
發行說明
Market Context"SMH ticker" field Replaced AMEX:SMH with NASDAQ:SMH
"SOX context ticker" field, replaced AMEX:SMH with INDEX:SOX
開源腳本
秉持TradingView一貫精神,這個腳本的創作者將其設為開源,以便交易者檢視並驗證其功能。向作者致敬!您可以免費使用此腳本,但請注意,重新發佈代碼需遵守我們的社群規範。

免責聲明
這些資訊和出版物並非旨在提供,也不構成TradingView提供或認可的任何形式的財務、投資、交易或其他類型的建議或推薦。請閱讀使用條款以了解更多資訊。
免責聲明
這些資訊和出版物並非旨在提供,也不構成TradingView提供或認可的任何形式的財務、投資、交易或其他類型的建議或推薦。請閱讀使用條款以了解更多資訊。