Date & Season Highlight
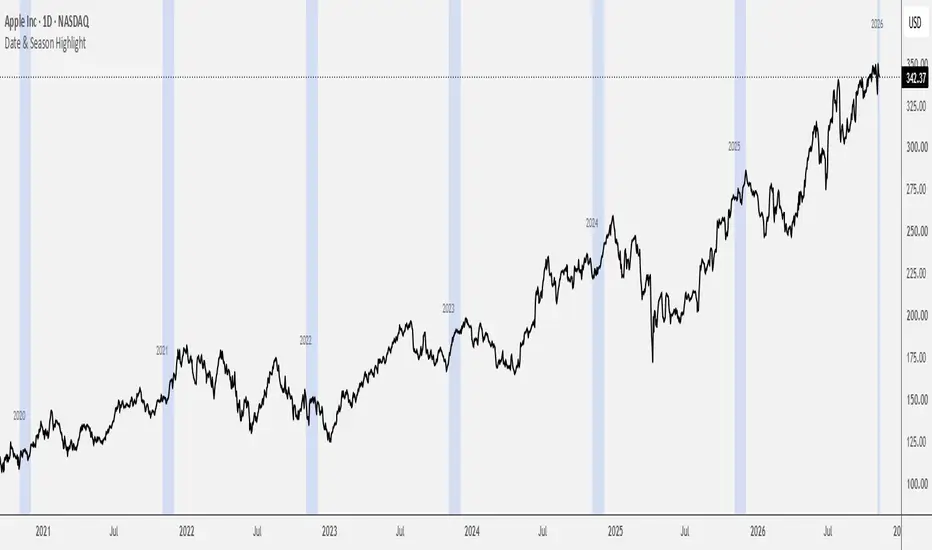
This Script indicator is designed to visually isolate and highlight specific months or years directly on your chart using background coloring. It serves as a practical tool for seasonality analysis, allowing you to instantly track and compare historical price behavior during specific periods of interest.
📊 Key Features:
Auto-Detect Mode (Live): Automatically identifies the current calendar month and highlights it across all historical data on your chart.
Manual Month Filter: Allows you to select any individual month (e.g., "July") to isolate past seasonal patterns.
Flexible Year Filter: Offers the ability to lock onto a single specific year or set the value to 0 to reveal the selected month across every year available in the history.
Dynamic Year Labels: Automatically prints clean, unobtrusive text labels at the beginning of each highlighted zone to keep your temporal perspective perfectly organized.
📊 Key Features:
Auto-Detect Mode (Live): Automatically identifies the current calendar month and highlights it across all historical data on your chart.
Manual Month Filter: Allows you to select any individual month (e.g., "July") to isolate past seasonal patterns.
Flexible Year Filter: Offers the ability to lock onto a single specific year or set the value to 0 to reveal the selected month across every year available in the history.
Dynamic Year Labels: Automatically prints clean, unobtrusive text labels at the beginning of each highlighted zone to keep your temporal perspective perfectly organized.

免責聲明
這些資訊和出版物並非旨在提供,也不構成TradingView提供或認可的任何形式的財務、投資、交易或其他類型的建議或推薦。請閱讀使用條款以了解更多資訊。
免責聲明
這些資訊和出版物並非旨在提供,也不構成TradingView提供或認可的任何形式的財務、投資、交易或其他類型的建議或推薦。請閱讀使用條款以了解更多資訊。