OPEN-SOURCE SCRIPT
Closewinter Volume Value
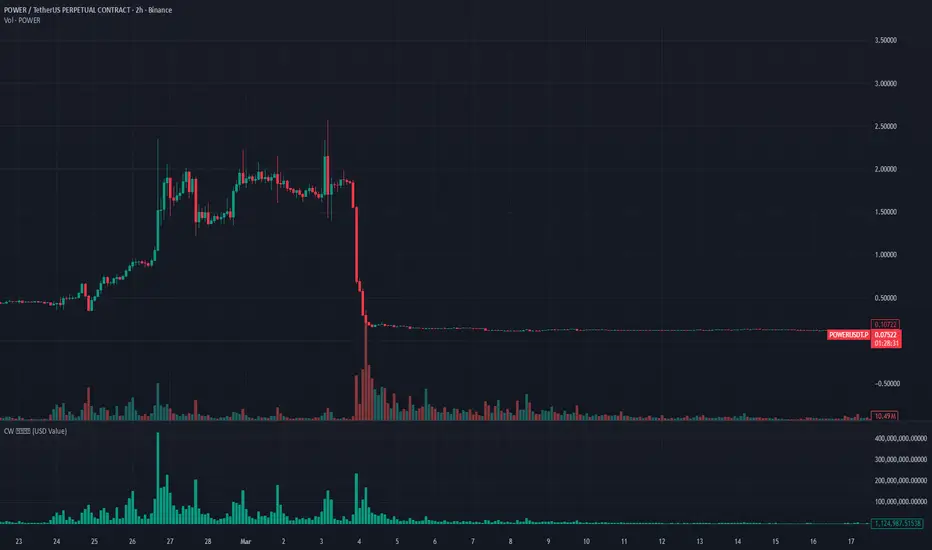
The Illusion of Token Count vs. Actual Capital Volume
To put it simply, the critical limitation of traditional volume indicators is that they fail to account for price changes and only display the absolute number of tokens traded.
For instance, buying $100 worth of an asset at $1 generates 100 tokens. However, buying $100 worth at $10 generates only 10 tokens. Even though the exact same amount of capital was deployed, the number of filled tokens varies depending on the price.
The inherent flaw is that standard charts do not reflect this disconnect—the fact that actual capital volume and token count are not strictly proportional. This is precisely why you must look at Traded Value (or Fiat Volume / Notional Volume) rather than just raw trading volume.
To put it simply, the critical limitation of traditional volume indicators is that they fail to account for price changes and only display the absolute number of tokens traded.
For instance, buying $100 worth of an asset at $1 generates 100 tokens. However, buying $100 worth at $10 generates only 10 tokens. Even though the exact same amount of capital was deployed, the number of filled tokens varies depending on the price.
The inherent flaw is that standard charts do not reflect this disconnect—the fact that actual capital volume and token count are not strictly proportional. This is precisely why you must look at Traded Value (or Fiat Volume / Notional Volume) rather than just raw trading volume.
開源腳本
秉持TradingView一貫精神,這個腳本的創作者將其設為開源,以便交易者檢視並驗證其功能。向作者致敬!您可以免費使用此腳本,但請注意,重新發佈代碼需遵守我們的社群規範。

免責聲明
這些資訊和出版物並非旨在提供,也不構成TradingView提供或認可的任何形式的財務、投資、交易或其他類型的建議或推薦。請閱讀使用條款以了解更多資訊。
開源腳本
秉持TradingView一貫精神,這個腳本的創作者將其設為開源,以便交易者檢視並驗證其功能。向作者致敬!您可以免費使用此腳本,但請注意,重新發佈代碼需遵守我們的社群規範。
免責聲明
這些資訊和出版物並非旨在提供,也不構成TradingView提供或認可的任何形式的財務、投資、交易或其他類型的建議或推薦。請閱讀使用條款以了解更多資訊。