OPEN-SOURCE SCRIPT
已更新 Previous Day/Week/Month High/Low
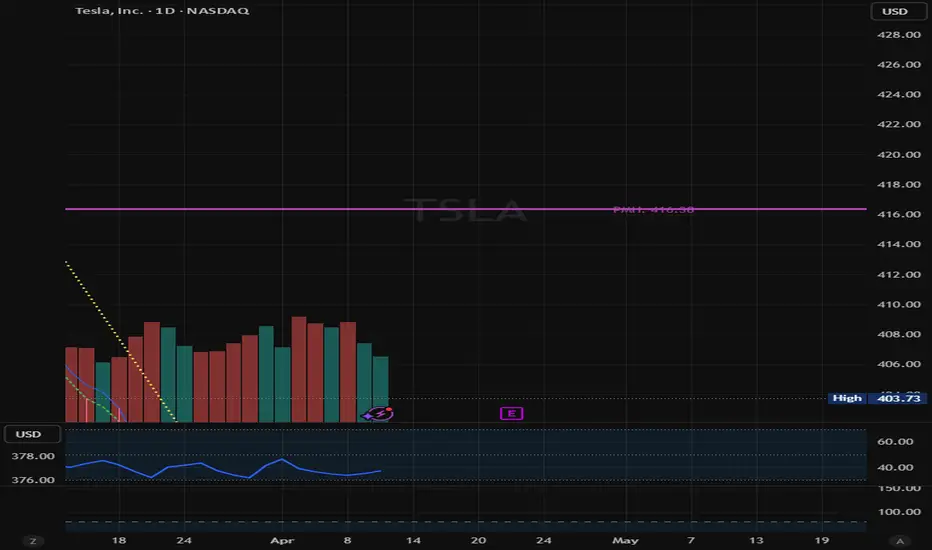
This script plots the previous day, week and month high and low.
發行說明
//version=6indicator("True Anchor H/L - Always-On Build", overlay=true, max_bars_back=5000)
// --- HELPER FUNCTION: Convert String to Line Style ---
getStyle(s) =>
s == "Dashed" ? line.style_dashed : s == "Dotted" ? line.style_dotted : line.style_solid
// --- GUI INPUTS ---
grp_g = "Global Settings"
label_off = input.int(6, "Label Vertical Offset (Ticks)", minval=0, group=grp_g)
// 10-Minute
grp_10 = "10-Minute Levels"
show_10 = input.bool(true, "Show P10mH/P10mL", group=grp_10)
col_10 = input.color(#9598a1, "Color", group=grp_10)
wid_10 = input.int(1, "Weight", minval=1, maxval=5, group=grp_10)
sty_10 = input.string("Solid", "Style", options=["Solid", "Dashed", "Dotted"], group=grp_10)
// Hourly
grp_h = "Hour Levels"
show_h = input.bool(true, "Show PHH/PHL", group=grp_h)
col_h = input.color(#ff9800, "Color", group=grp_h)
wid_h = input.int(1, "Weight", minval=1, maxval=5, group=grp_h)
sty_h = input.string("Solid", "Style", options=["Solid", "Dashed", "Dotted"], group=grp_h)
// Daily
grp_d = "Daily Levels"
show_d = input.bool(true, "Show Daily PDH/PDL", group=grp_d)
col_d = input.color(#86c7e6, "Color", group=grp_d)
wid_d = input.int(1, "Weight", minval=1, maxval=5, group=grp_d)
sty_d = input.string("Solid", "Style", options=["Solid", "Dashed", "Dotted"], group=grp_d)
// Weekly
grp_w = "Weekly Levels"
show_w = input.bool(true, "Show PWH/PWL", group=grp_w)
col_w = input.color(#e4bec4, "Color", group=grp_w)
wid_w = input.int(2, "Weight", minval=1, maxval=5, group=grp_w)
sty_w = input.string("Solid", "Style", options=["Solid", "Dashed", "Dotted"], group=grp_w)
// Monthly
grp_m = "Monthly Levels"
show_m = input.bool(true, "Show Monthly PMH/PML", group=grp_m)
col_m = input.color(#ac43ac, "Color", group=grp_m)
wid_m = input.int(2, "Weight", minval=1, maxval=5, group=grp_m)
sty_m = input.string("Solid", "Style", options=["Solid", "Dashed", "Dotted"], group=grp_m)
// --- 1. Fetch Price Levels ---
p10h = request.security(syminfo.tickerid, "10", high[1], lookahead=barmerge.lookahead_on)
p10l = request.security(syminfo.tickerid, "10", low[1], lookahead=barmerge.lookahead_on)
phh = request.security(syminfo.tickerid, "60", high[1], lookahead=barmerge.lookahead_on)
phl = request.security(syminfo.tickerid, "60", low[1], lookahead=barmerge.lookahead_on)
phd = request.security(syminfo.tickerid, "D", high[1], lookahead=barmerge.lookahead_on)
pld = request.security(syminfo.tickerid, "D", low[1], lookahead=barmerge.lookahead_on)
phw = request.security(syminfo.tickerid, "W", high[1], lookahead=barmerge.lookahead_on)
plw = request.security(syminfo.tickerid, "W", low[1], lookahead=barmerge.lookahead_on)
phm = request.security(syminfo.tickerid, "M", high[1], lookahead=barmerge.lookahead_on)
plm = request.security(syminfo.tickerid, "M", low[1], lookahead=barmerge.lookahead_on)
// --- 2. Anchoring Logic ---
tenMinAnchor = ta.valuewhen(ta.change(time("10")) != 0, bar_index, 1)
hourAnchor = ta.valuewhen(ta.change(time("60")) != 0, bar_index, 1)
dayAnchor = ta.valuewhen(ta.change(time("D")) != 0, bar_index, 1)
weekAnchor = ta.valuewhen(ta.change(time("W")) != 0, bar_index, 1)
monthAnchor = ta.valuewhen(ta.change(time("M")) != 0, bar_index, 1)
// --- 3. Drawing Function ---
drawLevel(anchorBar, price, useColor, width, styleStr, labelText, xOffset, isVisible) =>
if isVisible and not na(price) and not na(anchorBar)
int startX = int(anchorBar)
int endX = bar_index
if startX >= endX
startX := endX - 1
line.new(startX, price, endX, price, xloc.bar_index, extend.right, useColor, style=getStyle(styleStr), width=width, force_overlay=true)
float labelY = price - (syminfo.mintick * label_off)
label.new(x=endX + xOffset, y=labelY, text=labelText, xloc=xloc.bar_index, color=color(na), textcolor=useColor, style=label.style_label_left, size=size.small, force_overlay=true)
// --- 4. Execution ---
if barstate.islast
// Cleanup
line_arr = line.all
if array.size(line_arr) > 0
for i = 0 to array.size(line_arr) - 1
line.delete(array.get(line_arr, i))
label_arr = label.all
if array.size(label_arr) > 0
for i = 0 to array.size(label_arr) - 1
label.delete(array.get(label_arr, i))
// Render Logic (Filters removed to ensure visibility on all timeframes)
drawLevel(tenMinAnchor, p10h, col_10, wid_10, sty_10, "P10mH", 1, show_10)
drawLevel(tenMinAnchor, p10l, col_10, wid_10, sty_10, "P10mL", 1, show_10)
drawLevel(hourAnchor, phh, col_h, wid_h, sty_h, "PHH", 4, show_h)
drawLevel(hourAnchor, phl, col_h, wid_h, sty_h, "PHL", 4, show_h)
drawLevel(dayAnchor, phd, col_d, wid_d, sty_d, "PDH", 7, show_d)
drawLevel(dayAnchor, pld, col_d, wid_d, sty_d, "PDL", 7, show_d)
drawLevel(weekAnchor, phw, col_w, wid_w, sty_w, "PWH", 10, show_w)
drawLevel(weekAnchor, plw, col_w, wid_w, sty_w, "PWL", 10, show_w)
drawLevel(monthAnchor, phm, col_m, wid_m, sty_m, "PMH", 13, show_m)
drawLevel(monthAnchor, plm, col_m, wid_m, sty_m, "PML", 13, show_m)
發行說明
This will help you plot previous high timeframe levels automatically.you can change line style, weight and text placement.
this will only show smaller time frames when you go to that time frame (i.e. the 1H will only show the 1D, 1W and 1M levels while the 10m frame will also plot the 10m levels)
發行說明
.開源腳本
秉持TradingView一貫精神,這個腳本的創作者將其設為開源,以便交易者檢視並驗證其功能。向作者致敬!您可以免費使用此腳本,但請注意,重新發佈代碼需遵守我們的社群規範。

免責聲明
這些資訊和出版物並非旨在提供,也不構成TradingView提供或認可的任何形式的財務、投資、交易或其他類型的建議或推薦。請閱讀使用條款以了解更多資訊。
開源腳本
秉持TradingView一貫精神,這個腳本的創作者將其設為開源,以便交易者檢視並驗證其功能。向作者致敬!您可以免費使用此腳本,但請注意,重新發佈代碼需遵守我們的社群規範。
免責聲明
這些資訊和出版物並非旨在提供,也不構成TradingView提供或認可的任何形式的財務、投資、交易或其他類型的建議或推薦。請閱讀使用條款以了解更多資訊。