[CT] Volume Flow Candles
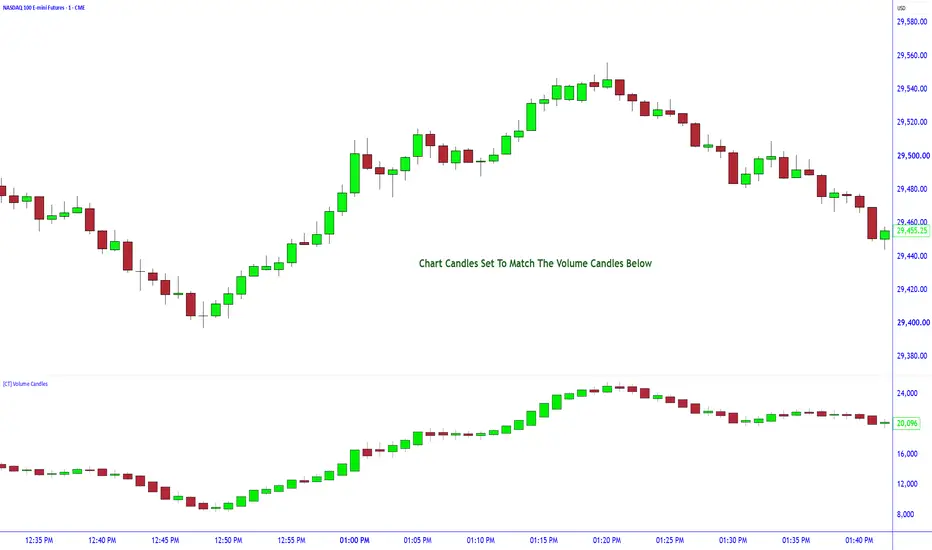
[CT] Volume Flow Candles — Smoothed OBV, Hybrid Volume Momentum & Trend Confirmation
OVERVIEW
[CT] Volume Flow Candles is an advanced volume-based candlestick indicator designed to help traders visualize volume momentum, identify potential shifts in buying and selling pressure, confirm market trends, and evaluate the strength of price movements.
Unlike traditional candlestick charts, which represent price movement, this indicator transforms On-Balance Volume (OBV) into a separate candlestick display.
The indicator combines Double Exponential Moving Average (DEMA) smoothing, a customizable Hybrid OBV Momentum engine, enhanced volume candle visualization, optional moving averages, and automatic price candle coloring.
One of its most powerful features is the ability to color the actual price candles on the main chart based on volume momentum rather than price direction alone.
This allows traders to compare price action with underlying volume conditions without constantly switching between indicators.
The purpose of Volume Flow Candles is not to predict every price movement, but to help traders evaluate whether volume momentum supports or challenges the current market direction.
━━━━━━━━━━━━━━━━━━━━━━━━━━
1. WHAT IS VOLUME FLOW CANDLES?
━━━━━━━━━━━━━━━━━━━━━━━━━━
Volume Flow Candles converts cumulative On-Balance Volume into a visual candlestick format.
OBV measures volume flow by adding or subtracting volume according to changes in closing price.
The resulting cumulative volume values are converted into candlesticks that help illustrate changes in volume direction and momentum.
Why use volume candles instead of a traditional OBV line?
Candlesticks make it easier to visually recognize:
The indicator is displayed in a separate panel beneath the main price chart.
━━━━━━━━━━━━━━━━━━━━━━━━━━
2. HYBRID OBV MOMENTUM ENGINE
━━━━━━━━━━━━━━━━━━━━━━━━━━
The Hybrid OBV Momentum engine is one of the indicator's primary features.
Rather than relying exclusively on raw or smoothed OBV, the indicator allows traders to combine both measurements.
Default Hybrid Calculation:
Smoothed OBV provides a more stable view of established volume direction.
Raw OBV responds directly to changes in cumulative volume, allowing shorter-term movements to influence the momentum reading.
Combining the two creates an adjustable balance between trend filtering and responsiveness.
Available Color Logic Modes:
Adjustable Hybrid Weighting
The default smoothed weighting is 70%, with the remaining 30% automatically assigned to raw OBV.
For example:
Traders can adjust this setting to experiment with the sensitivity of volume-momentum changes.
━━━━━━━━━━━━━━━━━━━━━━━━━━
3. NEW FEATURE — PRICE CANDLE COLORING
━━━━━━━━━━━━━━━━━━━━━━━━━━
Volume Flow Candles can now color the actual candlesticks on the main price chart using the same OBV momentum engine that drives the lower indicator.
This provides an additional way to monitor volume conditions directly alongside price action.
GREEN PRICE CANDLES — Bullish Volume Momentum
Green price candles indicate positive momentum according to the selected OBV color calculation.
This can suggest:
RED PRICE CANDLES — Bearish Volume Momentum
Red price candles indicate negative momentum according to the selected OBV color calculation.
This can suggest:
IMPORTANT DISTINCTION
Price candle colors represent OBV momentum, not necessarily the direction of the actual price candle.
For example:
This difference can help traders identify situations where price direction and volume momentum are not aligned.
Customizable Price Candle Colors
Traders can independently customize:
Candle Close Confirmation
When confirmation is enabled, the active candle retains the previous confirmed momentum color until the current candle closes.
When disabled, the active price candle can change colors as volume momentum changes during candle formation.
━━━━━━━━━━━━━━━━━━━━━━━━━━
4. SMOOTHED OBV CANDLE CONSTRUCTION
━━━━━━━━━━━━━━━━━━━━━━━━━━
The default configuration uses DEMA smoothing with a period of 8.
DEMA is designed to respond more quickly than a conventional EMA of comparable length while maintaining smoothing.
Available Calculation Modes:
Available Smoothing Methods:
Traders can adjust smoothing to study different levels of responsiveness.
━━━━━━━━━━━━━━━━━━━━━━━━━━
5. ENHANCED VOLUME CANDLE VISIBILITY
━━━━━━━━━━━━━━━━━━━━━━━━━━
Another important enhancement is the ability to increase the visibility of volume candles, especially during periods of weak momentum.
Small OBV movements can produce very small candle bodies that are difficult to distinguish visually.
The enhanced candle-sizing system addresses this through three adjustable controls.
Visual Candle Body Size
Increases the displayed height of the lower-panel volume candle bodies.
Default: 1.75×.
Minimum Body Strength
Establishes a minimum displayed height for nonzero candle bodies using a percentage of the recent average body magnitude.
Default: 50%.
Average Body Lookback
Determines the number of candles used to calculate the average body magnitude.
Default: 20.
These settings help make smaller momentum changes easier to identify.
IMPORTANT:
The visual sizing feature does not increase actual OBV values or change the underlying volume-momentum calculations.
Enlarged candle bodies are for readability and should not be interpreted as representing proportionally greater buying or selling pressure.
━━━━━━━━━━━━━━━━━━━━━━━━━━
6. HOW TO TRADE WITH VOLUME FLOW CANDLES
━━━━━━━━━━━━━━━━━━━━━━━━━━
STRATEGY 1 — TREND FOLLOWING WITH VOLUME CONFIRMATION
The first application is identifying when volume momentum supports the prevailing market direction.
Bullish Trend Setup
Bearish Trend Setup
Trading Principle:
Use price structure to determine directional bias and Volume Flow Candles to evaluate supporting volume momentum.
STRATEGY 2 — EARLY VOLUME MOMENTUM SHIFTS
Volume Flow Candles can help traders monitor potential momentum changes before price establishes a confirmed reversal.
Potential Bullish Momentum Shift
Potential Bearish Momentum Shift
Important: A single opposite-colored candle is not sufficient evidence of a trend reversal.
STRATEGY 3 — PULLBACK AND TREND CONTINUATION
One of the practical applications is using volume momentum to assess whether a pullback may be ending.
Bullish Continuation Example
For bearish continuation setups, reverse the conditions.
STRATEGY 4 — PRICE AND VOLUME DISAGREEMENT
The main-chart candle coloring makes it easier to identify moments when price direction and calculated volume momentum disagree.
Example — Bullish Price With Bearish Volume Momentum
Example — Bearish Price With Bullish Volume Momentum
A disagreement in candle color is not automatically a classical bullish or bearish divergence. Traditional divergence analysis compares corresponding swing highs and lows in price and OBV.
STRATEGY 5 — MARKET STRUCTURE CONFIRMATION
Volume Flow Candles can complement price-action strategies involving:
Bullish Example
Bearish Example
The objective is to combine market structure, price action, and volume-momentum confirmation.
━━━━━━━━━━━━━━━━━━━━━━━━━━
7. MOVING AVERAGES AND CROSSOVER SIGNALS
━━━━━━━━━━━━━━━━━━━━━━━━━━
The indicator provides three optional moving averages calculated from the volume-candle close series.
Default Lengths:
Available moving-average methods include EMA, DEMA, TEMA, SMA, WMA, RMA, and HMA.
Bullish MA Crossover
Occurs when the first volume moving average crosses above the second.
Bearish MA Crossunder
Occurs when the first volume moving average crosses below the second.
Optional crossover markers can be enabled independently of whether the moving-average lines are visible.
These signals are derived from the OBV-based candle series, not price moving averages.
━━━━━━━━━━━━━━━━━━━━━━━━━━
8. ALERT CONDITIONS
━━━━━━━━━━━━━━━━━━━━━━━━━━
Four alert conditions are available.
The indicator includes an optional candle-close confirmation setting.
When enabled, alerts are confirmed only after the current bar closes.
━━━━━━━━━━━━━━━━━━━━━━━━━━
9. RECOMMENDED DEFAULT SETTINGS
━━━━━━━━━━━━━━━━━━━━━━━━━━
The indicator is configured with the following defaults:
These defaults provide a starting point for volume-momentum analysis. Traders should evaluate them on their own instruments, timeframes, and trading approaches.
━━━━━━━━━━━━━━━━━━━━━━━━━━
10. MARKETS AND TIMEFRAMES
━━━━━━━━━━━━━━━━━━━━━━━━━━
Volume Flow Candles can be used on instruments where suitable volume data is available.
Examples include:
The indicator can be applied to intraday and higher timeframes.
Because the calculations depend on the chart's supplied volume data, results can vary across markets, sessions, exchanges, and data providers.
━━━━━━━━━━━━━━━━━━━━━━━━━━
11. IMPORTANT CONSIDERATIONS
━━━━━━━━━━━━━━━━━━━━━━━━━━
Volume Flow Candles should be combined with sound trade selection, price-action analysis, appropriate position sizing, and risk management.
━━━━━━━━━━━━━━━━━━━━━━━━━━
FINAL THOUGHTS
━━━━━━━━━━━━━━━━━━━━━━━━━━
[CT] Volume Flow Candles transforms traditional OBV analysis into an intuitive volume-based candlestick system.
With Hybrid OBV Momentum, customizable smoothing, enhanced candle visibility, automatic main-chart candle coloring, optional moving averages, and alerts, traders can study how volume momentum behaves during trends, corrections, consolidations, and potential reversals.
The key advantage is being able to view price action and volume momentum together, making it easier to recognize alignment or disagreement between the two.
Follow the structure. Confirm the volume momentum. Trade with discipline.
CREDITS & ACKNOWLEDGMENT
This indicator is an independently developed implementation using established On-Balance Volume principles and custom smoothing, hybrid momentum coloring, visual candle-sizing, and main-chart candle-coloring techniques.
Acknowledgment is given to the TradingView indicator Volume Candle [SHK] by its original author, which served as a visual reference during development. This implementation does not reproduce or claim access to the original protected source code.
DISCLAIMER
This indicator is provided for educational and technical-analysis purposes only and is not investment advice. No indicator guarantees accurate signals or profitable trades. Futures and leveraged trading involve substantial financial risk.
OVERVIEW
[CT] Volume Flow Candles is an advanced volume-based candlestick indicator designed to help traders visualize volume momentum, identify potential shifts in buying and selling pressure, confirm market trends, and evaluate the strength of price movements.
Unlike traditional candlestick charts, which represent price movement, this indicator transforms On-Balance Volume (OBV) into a separate candlestick display.
The indicator combines Double Exponential Moving Average (DEMA) smoothing, a customizable Hybrid OBV Momentum engine, enhanced volume candle visualization, optional moving averages, and automatic price candle coloring.
One of its most powerful features is the ability to color the actual price candles on the main chart based on volume momentum rather than price direction alone.
This allows traders to compare price action with underlying volume conditions without constantly switching between indicators.
The purpose of Volume Flow Candles is not to predict every price movement, but to help traders evaluate whether volume momentum supports or challenges the current market direction.
━━━━━━━━━━━━━━━━━━━━━━━━━━
1. WHAT IS VOLUME FLOW CANDLES?
━━━━━━━━━━━━━━━━━━━━━━━━━━
Volume Flow Candles converts cumulative On-Balance Volume into a visual candlestick format.
OBV measures volume flow by adding or subtracting volume according to changes in closing price.
- When price closes above the previous close, that bar's volume is added to OBV.
- When price closes below the previous close, that bar's volume is subtracted from OBV.
- When the closing price is unchanged, OBV remains unchanged.
The resulting cumulative volume values are converted into candlesticks that help illustrate changes in volume direction and momentum.
Why use volume candles instead of a traditional OBV line?
Candlesticks make it easier to visually recognize:
- Bullish and bearish volume momentum.
- Changes in directional volume pressure.
- Momentum acceleration and deceleration.
- Temporary countertrend volume shifts.
- Volume consolidation.
- Potential volume divergence against price movement.
The indicator is displayed in a separate panel beneath the main price chart.
━━━━━━━━━━━━━━━━━━━━━━━━━━
2. HYBRID OBV MOMENTUM ENGINE
━━━━━━━━━━━━━━━━━━━━━━━━━━
The Hybrid OBV Momentum engine is one of the indicator's primary features.
Rather than relying exclusively on raw or smoothed OBV, the indicator allows traders to combine both measurements.
Default Hybrid Calculation:
- 70% Smoothed OBV Momentum
- 30% Raw OBV Momentum
Smoothed OBV provides a more stable view of established volume direction.
Raw OBV responds directly to changes in cumulative volume, allowing shorter-term movements to influence the momentum reading.
Combining the two creates an adjustable balance between trend filtering and responsiveness.
Available Color Logic Modes:
- Smoothed OBV Direction: Colors are determined by changes in smoothed OBV.
- Raw OBV Direction: Colors respond to changes in unsmoothed OBV.
- Hybrid OBV Direction: Colors are determined by a weighted combination of smoothed and raw OBV changes.
Adjustable Hybrid Weighting
The default smoothed weighting is 70%, with the remaining 30% automatically assigned to raw OBV.
For example:
- 50% Smoothed / 50% Raw — Greater raw-volume influence.
- 70% Smoothed / 30% Raw — Default balanced approach.
- 85% Smoothed / 15% Raw — Greater emphasis on smoothed momentum.
- 100% Smoothed / 0% Raw — Entirely smoothed momentum.
Traders can adjust this setting to experiment with the sensitivity of volume-momentum changes.
━━━━━━━━━━━━━━━━━━━━━━━━━━
3. NEW FEATURE — PRICE CANDLE COLORING
━━━━━━━━━━━━━━━━━━━━━━━━━━
Volume Flow Candles can now color the actual candlesticks on the main price chart using the same OBV momentum engine that drives the lower indicator.
This provides an additional way to monitor volume conditions directly alongside price action.
GREEN PRICE CANDLES — Bullish Volume Momentum
Green price candles indicate positive momentum according to the selected OBV color calculation.
This can suggest:
- Positive directional volume movement.
- Volume momentum supporting a bullish move.
- Improving volume conditions during a bearish pullback.
- A potential early improvement in volume momentum before a confirmed price reversal.
RED PRICE CANDLES — Bearish Volume Momentum
Red price candles indicate negative momentum according to the selected OBV color calculation.
This can suggest:
- Negative directional volume movement.
- Volume momentum supporting a bearish move.
- Weakening volume conditions during an upward price movement.
- A potential early warning of deteriorating bullish volume momentum.
IMPORTANT DISTINCTION
Price candle colors represent OBV momentum, not necessarily the direction of the actual price candle.
For example:
- A price candle may close higher while displaying red because the selected volume-momentum calculation is bearish.
- A price candle may close lower while displaying green because the selected volume-momentum calculation is bullish.
This difference can help traders identify situations where price direction and volume momentum are not aligned.
Customizable Price Candle Colors
Traders can independently customize:
- Enable or disable main-chart candle coloring.
- Bullish price candle color.
- Bearish price candle color.
- Optional confirmation of price candle colors on candle close.
Candle Close Confirmation
When confirmation is enabled, the active candle retains the previous confirmed momentum color until the current candle closes.
When disabled, the active price candle can change colors as volume momentum changes during candle formation.
━━━━━━━━━━━━━━━━━━━━━━━━━━
4. SMOOTHED OBV CANDLE CONSTRUCTION
━━━━━━━━━━━━━━━━━━━━━━━━━━
The default configuration uses DEMA smoothing with a period of 8.
DEMA is designed to respond more quickly than a conventional EMA of comparable length while maintaining smoothing.
Available Calculation Modes:
- Smoothed OBV First: Smooths cumulative OBV before constructing the volume candles from consecutive values.
- Individual OHLC Smoothing: Smooths the components of synthetic OBV candles independently.
- Raw OBV Candles: Displays volume-derived candles without the selected smoothing applied to their construction.
Available Smoothing Methods:
- EMA — Exponential Moving Average
- DEMA — Double Exponential Moving Average
- TEMA — Triple Exponential Moving Average
- SMA — Simple Moving Average
- RMA — Running Moving Average
- WMA — Weighted Moving Average
Traders can adjust smoothing to study different levels of responsiveness.
━━━━━━━━━━━━━━━━━━━━━━━━━━
5. ENHANCED VOLUME CANDLE VISIBILITY
━━━━━━━━━━━━━━━━━━━━━━━━━━
Another important enhancement is the ability to increase the visibility of volume candles, especially during periods of weak momentum.
Small OBV movements can produce very small candle bodies that are difficult to distinguish visually.
The enhanced candle-sizing system addresses this through three adjustable controls.
Visual Candle Body Size
Increases the displayed height of the lower-panel volume candle bodies.
Default: 1.75×.
Minimum Body Strength
Establishes a minimum displayed height for nonzero candle bodies using a percentage of the recent average body magnitude.
Default: 50%.
Average Body Lookback
Determines the number of candles used to calculate the average body magnitude.
Default: 20.
These settings help make smaller momentum changes easier to identify.
IMPORTANT:
The visual sizing feature does not increase actual OBV values or change the underlying volume-momentum calculations.
Enlarged candle bodies are for readability and should not be interpreted as representing proportionally greater buying or selling pressure.
━━━━━━━━━━━━━━━━━━━━━━━━━━
6. HOW TO TRADE WITH VOLUME FLOW CANDLES
━━━━━━━━━━━━━━━━━━━━━━━━━━
STRATEGY 1 — TREND FOLLOWING WITH VOLUME CONFIRMATION
The first application is identifying when volume momentum supports the prevailing market direction.
Bullish Trend Setup
- Identify bullish market structure with higher highs and higher lows.
- Look for predominantly green Volume Flow Candles.
- Confirm that the main price candles are displaying positive volume momentum.
- Wait for a pullback toward support, a moving average, or a bullish market-structure zone.
- Look for a bullish price-action entry trigger supported by improving volume momentum.
- Define stop-loss placement and risk before entering.
Bearish Trend Setup
- Identify bearish market structure with lower highs and lower lows.
- Look for predominantly red Volume Flow Candles.
- Confirm negative volume momentum through the main-chart candle coloring.
- Wait for a pullback toward resistance or a bearish market-structure zone.
- Look for renewed bearish price action supported by negative volume momentum.
- Enter only when the trade satisfies your established entry and risk rules.
Trading Principle:
Use price structure to determine directional bias and Volume Flow Candles to evaluate supporting volume momentum.
STRATEGY 2 — EARLY VOLUME MOMENTUM SHIFTS
Volume Flow Candles can help traders monitor potential momentum changes before price establishes a confirmed reversal.
Potential Bullish Momentum Shift
- Price remains in a bearish trend.
- Volume Flow Candles have been predominantly red.
- Green volume candles begin appearing.
- The main price candles may begin displaying bullish volume colors.
- Watch for bullish price confirmation, such as a higher low, resistance break, or bullish CHoCH.
Potential Bearish Momentum Shift
- Price remains in a bullish trend.
- Volume Flow Candles have been predominantly green.
- Red volume candles begin appearing.
- The main price candles may begin displaying bearish volume colors.
- Watch for bearish price confirmation, such as a lower high, support break, or bearish CHoCH.
Important: A single opposite-colored candle is not sufficient evidence of a trend reversal.
STRATEGY 3 — PULLBACK AND TREND CONTINUATION
One of the practical applications is using volume momentum to assess whether a pullback may be ending.
Bullish Continuation Example
- Establish a bullish higher-timeframe price bias.
- Identify a strong bullish price movement supported by green volume candles.
- Allow price to retrace toward a support or continuation zone.
- Monitor whether volume momentum weakens during the pullback.
- Look for renewed green volume momentum as price stabilizes.
- Wait for your bullish price-action entry trigger.
For bearish continuation setups, reverse the conditions.
STRATEGY 4 — PRICE AND VOLUME DISAGREEMENT
The main-chart candle coloring makes it easier to identify moments when price direction and calculated volume momentum disagree.
Example — Bullish Price With Bearish Volume Momentum
- Price is advancing.
- The main price candles begin displaying bearish volume colors.
- The lower Volume Flow Candles also show negative momentum.
- This may indicate that the current price movement is not supported by the selected OBV momentum calculation.
- Watch for subsequent price-action confirmation before assuming a reversal.
Example — Bearish Price With Bullish Volume Momentum
- Price is declining.
- Price candles begin displaying bullish volume colors.
- The lower indicator shows positive volume momentum.
- This may signal improving volume conditions during the decline.
- Watch for bullish structure confirmation before considering a reversal.
A disagreement in candle color is not automatically a classical bullish or bearish divergence. Traditional divergence analysis compares corresponding swing highs and lows in price and OBV.
STRATEGY 5 — MARKET STRUCTURE CONFIRMATION
Volume Flow Candles can complement price-action strategies involving:
- Break of Structure (BOS)
- Change of Character (CHoCH)
- Support and resistance
- Breaker blocks
- Supply and demand zones
- Trend continuation pullbacks
Bullish Example
- Price establishes a bullish structural shift.
- Price pulls back toward a meaningful support zone.
- Volume Flow Candles turn or remain green.
- Main-chart price candle coloring confirms positive volume momentum.
- Wait for a bullish price-action trigger.
Bearish Example
- Price establishes a bearish structural shift.
- Price returns toward resistance.
- Volume Flow Candles turn or remain red.
- Main-chart price candles indicate negative volume momentum.
- Wait for a bearish entry trigger.
The objective is to combine market structure, price action, and volume-momentum confirmation.
━━━━━━━━━━━━━━━━━━━━━━━━━━
7. MOVING AVERAGES AND CROSSOVER SIGNALS
━━━━━━━━━━━━━━━━━━━━━━━━━━
The indicator provides three optional moving averages calculated from the volume-candle close series.
Default Lengths:
- MA 1: 8
- MA 2: 21
- MA 3: 1
Available moving-average methods include EMA, DEMA, TEMA, SMA, WMA, RMA, and HMA.
Bullish MA Crossover
Occurs when the first volume moving average crosses above the second.
Bearish MA Crossunder
Occurs when the first volume moving average crosses below the second.
Optional crossover markers can be enabled independently of whether the moving-average lines are visible.
These signals are derived from the OBV-based candle series, not price moving averages.
━━━━━━━━━━━━━━━━━━━━━━━━━━
8. ALERT CONDITIONS
━━━━━━━━━━━━━━━━━━━━━━━━━━
Four alert conditions are available.
- Bullish Volume Flow: Volume momentum changes from bearish to bullish.
- Bearish Volume Flow: Volume momentum changes from bullish to bearish.
- Bullish MA Crossover: MA 1 crosses above MA 2.
- Bearish MA Crossunder: MA 1 crosses below MA 2.
The indicator includes an optional candle-close confirmation setting.
When enabled, alerts are confirmed only after the current bar closes.
━━━━━━━━━━━━━━━━━━━━━━━━━━
9. RECOMMENDED DEFAULT SETTINGS
━━━━━━━━━━━━━━━━━━━━━━━━━━
The indicator is configured with the following defaults:
- Calculation Mode: Smoothed OBV First
- Enable Smoothing: Yes
- Smoothing Method: DEMA
- Smoother Length: 8
- Color Logic: Hybrid OBV Direction
- Hybrid Smoothed Weight: 70%
- Hybrid Raw Weight: 30% (automatically calculated)
- Force Colors To Match Candle Bodies: No
- Price Candle Coloring: Enabled
- Confirm Price Colors On Candle Close: Disabled
- Visual Candle Body Size: 1.75
- Minimum Body Strength: 50%
- Average Body Lookback: 20
- Moving Averages: Disabled
- MA Cross Shapes: Disabled
- Confirm Alert Signals On Candle Close: Enabled
These defaults provide a starting point for volume-momentum analysis. Traders should evaluate them on their own instruments, timeframes, and trading approaches.
━━━━━━━━━━━━━━━━━━━━━━━━━━
10. MARKETS AND TIMEFRAMES
━━━━━━━━━━━━━━━━━━━━━━━━━━
Volume Flow Candles can be used on instruments where suitable volume data is available.
Examples include:
- NASDAQ futures — NQ and MNQ.
- S&P 500 futures — ES and MES.
- Stocks and ETFs.
- Other futures markets.
- Cryptocurrency markets with trading-volume data.
- Other supported markets with reliable volume inputs.
The indicator can be applied to intraday and higher timeframes.
Because the calculations depend on the chart's supplied volume data, results can vary across markets, sessions, exchanges, and data providers.
━━━━━━━━━━━━━━━━━━━━━━━━━━
11. IMPORTANT CONSIDERATIONS
━━━━━━━━━━━━━━━━━━━━━━━━━━
- Volume momentum is not the same as price direction.
- Green candles do not guarantee prices will rise.
- Red candles do not guarantee prices will fall.
- The current candle's momentum color may change before it closes.
- A single countertrend candle does not establish a reversal.
- OBV reflects cumulative volume assigned according to closing-price direction; it does not directly measure aggressive buying versus selling.
- Smoothing can introduce lag, while increased sensitivity can create additional false signals.
- The enlarged candle-body option affects visualization, not the actual volume calculation.
- If other indicators also color price candles, their coloring behavior may conflict.
Volume Flow Candles should be combined with sound trade selection, price-action analysis, appropriate position sizing, and risk management.
━━━━━━━━━━━━━━━━━━━━━━━━━━
FINAL THOUGHTS
━━━━━━━━━━━━━━━━━━━━━━━━━━
[CT] Volume Flow Candles transforms traditional OBV analysis into an intuitive volume-based candlestick system.
With Hybrid OBV Momentum, customizable smoothing, enhanced candle visibility, automatic main-chart candle coloring, optional moving averages, and alerts, traders can study how volume momentum behaves during trends, corrections, consolidations, and potential reversals.
The key advantage is being able to view price action and volume momentum together, making it easier to recognize alignment or disagreement between the two.
Follow the structure. Confirm the volume momentum. Trade with discipline.
CREDITS & ACKNOWLEDGMENT
This indicator is an independently developed implementation using established On-Balance Volume principles and custom smoothing, hybrid momentum coloring, visual candle-sizing, and main-chart candle-coloring techniques.
Acknowledgment is given to the TradingView indicator Volume Candle [SHK] by its original author, which served as a visual reference during development. This implementation does not reproduce or claim access to the original protected source code.
DISCLAIMER
This indicator is provided for educational and technical-analysis purposes only and is not investment advice. No indicator guarantees accurate signals or profitable trades. Futures and leveraged trading involve substantial financial risk.

免責聲明
這些資訊和出版物並非旨在提供,也不構成TradingView提供或認可的任何形式的財務、投資、交易或其他類型的建議或推薦。請閱讀使用條款以了解更多資訊。
免責聲明
這些資訊和出版物並非旨在提供,也不構成TradingView提供或認可的任何形式的財務、投資、交易或其他類型的建議或推薦。請閱讀使用條款以了解更多資訊。