OPEN-SOURCE SCRIPT
已更新 NYSE Advance/Decline
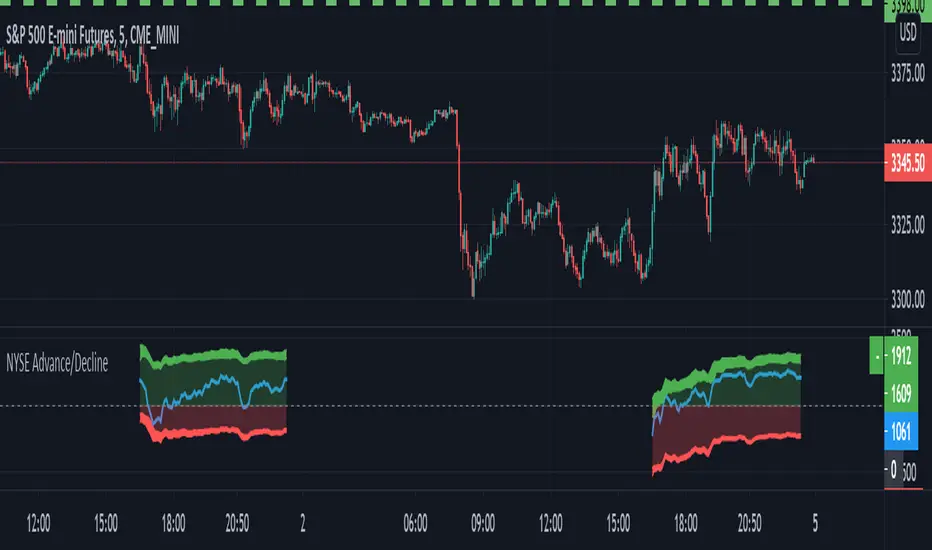
An indicator for traders who trade intraday on the US market. It makes use of the symbols made available by TradingView to show the number of advancing vs declining stocks.
The GREEN AREA represents advancing issues. The INTENSE GREEN AREA represents the advancing issues at daily high.
The RED AREA represents declining issues. The INTENSE RED AREA represents the declining issues at daily low.
The part above the BLUE LINE represents issues which are trading above their VWAP (volume-weighted average prices).
The GREEN AREA represents advancing issues. The INTENSE GREEN AREA represents the advancing issues at daily high.
The RED AREA represents declining issues. The INTENSE RED AREA represents the declining issues at daily low.
The part above the BLUE LINE represents issues which are trading above their VWAP (volume-weighted average prices).
發行說明
Small modification and bugfix (stopped showing a third red line (the number of stocks above 5-day moving average) which didn't make any sense because it wasn't intuitive - it wasn't updated in real time but only once a day).開源腳本
秉持TradingView一貫精神,這個腳本的創作者將其設為開源,以便交易者檢視並驗證其功能。向作者致敬!您可以免費使用此腳本,但請注意,重新發佈代碼需遵守我們的社群規範。

免責聲明
這些資訊和出版物並非旨在提供,也不構成TradingView提供或認可的任何形式的財務、投資、交易或其他類型的建議或推薦。請閱讀使用條款以了解更多資訊。
免責聲明
這些資訊和出版物並非旨在提供,也不構成TradingView提供或認可的任何形式的財務、投資、交易或其他類型的建議或推薦。請閱讀使用條款以了解更多資訊。