DCA vs Market Timing vs ATH Buying - Backtesting
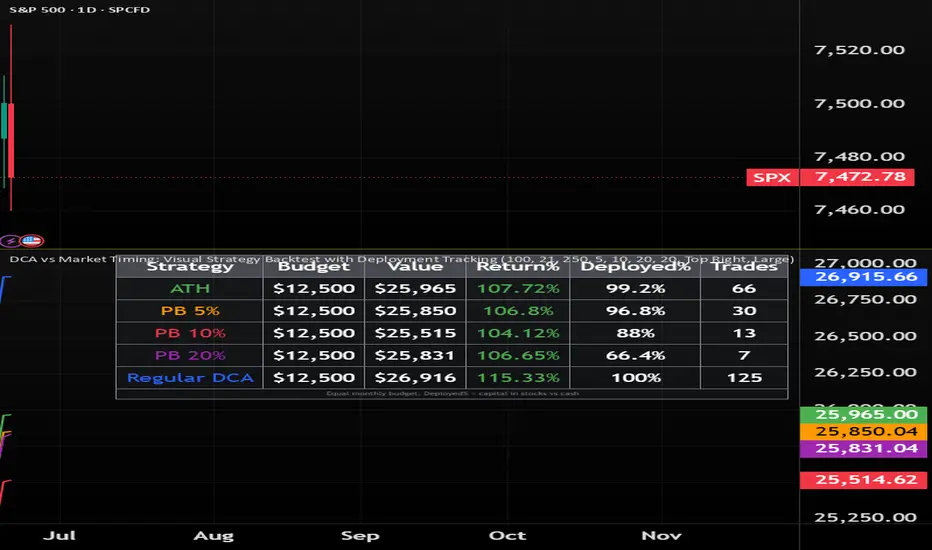
Compare investment timing strategies with equal capital to see which actually performs best.
This indicator backtests whether buying at all-time highs, waiting for pullbacks, or regular DCA builds more wealth over time.
Each strategy receives the same monthly budget (default $100). The difference is when they invest:
Key Metrics:
The Deployed% column reveals the hidden cost of waiting. Pullback strategies often underperform because they keep too much cash idle, missing the gains that occur while waiting for corrections.
Use Cases:
This indicator backtests whether buying at all-time highs, waiting for pullbacks, or regular DCA builds more wealth over time.
Each strategy receives the same monthly budget (default $100). The difference is when they invest:
- ATH Strategy: Invests when price hits new highs (1-year lookback default)
- Pullback Strategies: Wait for 5%, 10%, 15%, or 20% corrections before investing
- Regular DCA: Invests monthly regardless of price
Key Metrics:
- Budget: Total capital allocated (equal for all)
- Value: Current portfolio value (stocks + cash)
- Return%: Overall performance
- Deployed%: How much capital is actually invested vs sitting in cash earning 0%
- Trades: Number of investments made
The Deployed% column reveals the hidden cost of waiting. Pullback strategies often underperform because they keep too much cash idle, missing the gains that occur while waiting for corrections.
Use Cases:
- Validate whether waiting for corrections is worth the opportunity cost
- Test different pullback thresholds on historical data
- Compare ATH investing vs DCA vs market timing
- Analyze performance across different time periods
- Results typically show that time in the market beats timing the market—this tool lets you prove it with data.

Hedge Fund Manager | Wealth Educator | 20+ yrs investing | Stocks, ETFs & Crypto alerts | Join Henrique Wealth Academy for trade alerts & indicators → skool.com/be-limitless/
免責聲明
這些資訊和出版物並非旨在提供,也不構成TradingView提供或認可的任何形式的財務、投資、交易或其他類型的建議或推薦。請閱讀使用條款以了解更多資訊。
Hedge Fund Manager | Wealth Educator | 20+ yrs investing | Stocks, ETFs & Crypto alerts | Join Henrique Wealth Academy for trade alerts & indicators → skool.com/be-limitless/
免責聲明
這些資訊和出版物並非旨在提供,也不構成TradingView提供或認可的任何形式的財務、投資、交易或其他類型的建議或推薦。請閱讀使用條款以了解更多資訊。