OPEN-SOURCE SCRIPT
已更新 RSI Modified
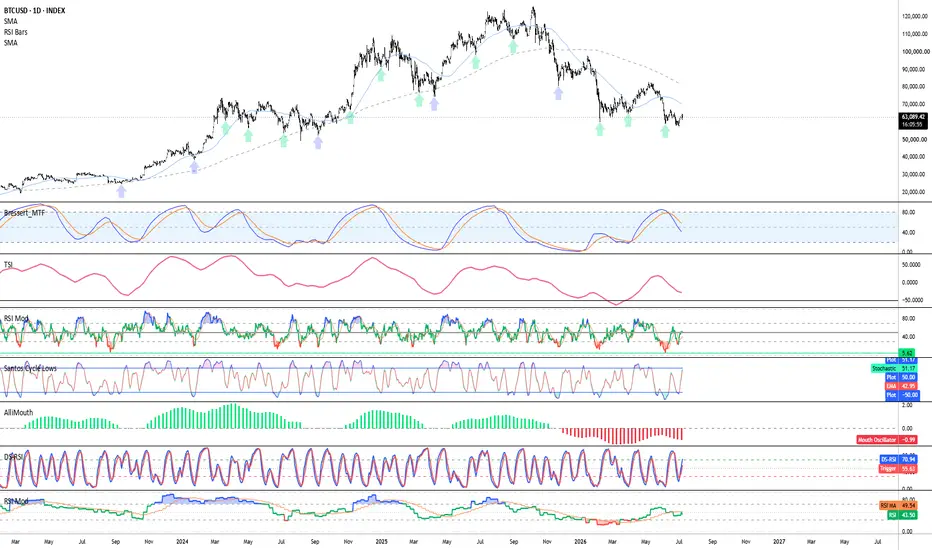
Relative Strength Index (RSI) Modified
Indicator Type: Standalone
Chart Type: Interactive Charts only
The RSI is another J. Welles Wilder, Jr. trading tool. The main purpose of the study is to measure the market's strength and weakness. A high RSI, above 70, suggests an overbought or weakening bull market. Conversely, a low RSI, below 30, implies an oversold market or dying bear market.
While you can use the RSI as an overbought and oversold indicator, it works best when a failure swing occurs between the RSI and market prices. For example, the market makes new highs after a bull market setback, but the RSI fails to exceed its previous highs.
Another use of the RSI is divergence. Market prices continue to move higher/lower while the RSI fails to move higher/lower during the same time period. Divergence may occur in a few trading intervals, but true divergence usually requires a lengthy time frame, perhaps as much as 20 to 60 trading intervals.
Selling when the RSI is above 70 or buying when the RSI is below 30 can be an expensive trading system. A move to those levels is a signal that market conditions are ripe for a market top or bottom. It does not indicate a top or a bottom. A failure swing or divergence accompanies your best trading signals.
The RSI exhibits chart formations as well. Common bar chart formations readily appear on the RSI study. They are trendlines, pennants, flags, head and shoulders, double tops and bottoms, and triangles. In addition, the study can highlight support and resistance zones.
Parameters:
Period (14) - the number of bars, or period, used to calculate the study.
Range (100) - the distance between the upper and lower threshold lines.
Computation
The RSI computations are not difficult, but they are tedious. You first calculate the difference between the current closing price and the previous closing price. The general formula is:
DIFt = Closet - Closet-1
If that difference is a positive value, it is an up period - the current close is higher than previous close. If the difference is negative, it is a down period - the current close is below the previous close. The indicator maintains the DIF value for a series of UP and DOWN days. The DOWN value is always a positive number for all computations. It is the absolute value of a negative DIF.
The worksheet below shows the calculations needed to create a 9 period RSI.
Day Current Close Previous Close Dif Up Down
1 7450 7430 +20 20 0
2 7460 7450 +10 10 0
3 7470 7460 +10 10 0
4 7480 7470 +10 10 0
5 7485 7480 +5 5 0
6 7490 7485 +5 5 0
7 7480 7490 -10 0 10
8 7470 7480 -10 0 10
9 7455 7470 -15 0 15
Totals 60 35
You now compute the up and down averages, which are calculated as follows:
Ut = (UP1 +... + UPi) / n
Dt = (DOWN1 +... + DOWNn) / n
Ut is the up average for the current period.
Dt is the down average for the current period.
UPn is the UP value for the nth period.
DOWNn is the DOWN value for the nth period.
n is the number of periods for the RSI.
Now, use the values from the worksheet. The up average is:
U = 60 / 9
= 6.67
and the down average is:
D = 35 / 9
= 3.89
The general formula for the RSI is:
RSIt = ( UT / (UT + DT) ) * 100
If you use the above values and place them in the formula, it appears as follows:
RSI = ( 6.67 / ( 6.67 + 3.89 )) * 100
= 63.16
Assume the market continues the downward trend. The next DIF value is -15, which sets the UP value to 0, zero, and the DOWN value to 15. Calculate the next up and down average by using Wilder's accumulative moving average technique. The formulae are:
UT = ( (UT-1 * (n-1) ) + UPt) / n
= ( (6.67 * (9 -1) ) + 0) / 9
= 5.93
DT = ( ( DT-1 * (n-1) ) + DOWNt) / n
= ( ( 3.89 * (9 - 1) ) + 15) / 9
= 5.12
The value for the new RSI equals the following:
RSI = ( (5.93) / (5.93 + 5.12)) * 100
= 53.67
The software continues these calculations for the entire data series.
Indicator Type: Standalone
Chart Type: Interactive Charts only
The RSI is another J. Welles Wilder, Jr. trading tool. The main purpose of the study is to measure the market's strength and weakness. A high RSI, above 70, suggests an overbought or weakening bull market. Conversely, a low RSI, below 30, implies an oversold market or dying bear market.
While you can use the RSI as an overbought and oversold indicator, it works best when a failure swing occurs between the RSI and market prices. For example, the market makes new highs after a bull market setback, but the RSI fails to exceed its previous highs.
Another use of the RSI is divergence. Market prices continue to move higher/lower while the RSI fails to move higher/lower during the same time period. Divergence may occur in a few trading intervals, but true divergence usually requires a lengthy time frame, perhaps as much as 20 to 60 trading intervals.
Selling when the RSI is above 70 or buying when the RSI is below 30 can be an expensive trading system. A move to those levels is a signal that market conditions are ripe for a market top or bottom. It does not indicate a top or a bottom. A failure swing or divergence accompanies your best trading signals.
The RSI exhibits chart formations as well. Common bar chart formations readily appear on the RSI study. They are trendlines, pennants, flags, head and shoulders, double tops and bottoms, and triangles. In addition, the study can highlight support and resistance zones.
Parameters:
Period (14) - the number of bars, or period, used to calculate the study.
Range (100) - the distance between the upper and lower threshold lines.
Computation
The RSI computations are not difficult, but they are tedious. You first calculate the difference between the current closing price and the previous closing price. The general formula is:
DIFt = Closet - Closet-1
If that difference is a positive value, it is an up period - the current close is higher than previous close. If the difference is negative, it is a down period - the current close is below the previous close. The indicator maintains the DIF value for a series of UP and DOWN days. The DOWN value is always a positive number for all computations. It is the absolute value of a negative DIF.
The worksheet below shows the calculations needed to create a 9 period RSI.
Day Current Close Previous Close Dif Up Down
1 7450 7430 +20 20 0
2 7460 7450 +10 10 0
3 7470 7460 +10 10 0
4 7480 7470 +10 10 0
5 7485 7480 +5 5 0
6 7490 7485 +5 5 0
7 7480 7490 -10 0 10
8 7470 7480 -10 0 10
9 7455 7470 -15 0 15
Totals 60 35
You now compute the up and down averages, which are calculated as follows:
Ut = (UP1 +... + UPi) / n
Dt = (DOWN1 +... + DOWNn) / n
Ut is the up average for the current period.
Dt is the down average for the current period.
UPn is the UP value for the nth period.
DOWNn is the DOWN value for the nth period.
n is the number of periods for the RSI.
Now, use the values from the worksheet. The up average is:
U = 60 / 9
= 6.67
and the down average is:
D = 35 / 9
= 3.89
The general formula for the RSI is:
RSIt = ( UT / (UT + DT) ) * 100
If you use the above values and place them in the formula, it appears as follows:
RSI = ( 6.67 / ( 6.67 + 3.89 )) * 100
= 63.16
Assume the market continues the downward trend. The next DIF value is -15, which sets the UP value to 0, zero, and the DOWN value to 15. Calculate the next up and down average by using Wilder's accumulative moving average technique. The formulae are:
UT = ( (UT-1 * (n-1) ) + UPt) / n
= ( (6.67 * (9 -1) ) + 0) / 9
= 5.93
DT = ( ( DT-1 * (n-1) ) + DOWNt) / n
= ( ( 3.89 * (9 - 1) ) + 15) / 9
= 5.12
The value for the new RSI equals the following:
RSI = ( (5.93) / (5.93 + 5.12)) * 100
= 53.67
The software continues these calculations for the entire data series.
發行說明
Barchart Relative Strength Index (RSI) Modified發行說明
Multi timeframe開源腳本
秉持TradingView一貫精神,這個腳本的創作者將其設為開源,以便交易者檢視並驗證其功能。向作者致敬!您可以免費使用此腳本,但請注意,重新發佈代碼需遵守我們的社群規範。

免責聲明
這些資訊和出版物並非旨在提供,也不構成TradingView提供或認可的任何形式的財務、投資、交易或其他類型的建議或推薦。請閱讀使用條款以了解更多資訊。
開源腳本
秉持TradingView一貫精神,這個腳本的創作者將其設為開源,以便交易者檢視並驗證其功能。向作者致敬!您可以免費使用此腳本,但請注意,重新發佈代碼需遵守我們的社群規範。
免責聲明
這些資訊和出版物並非旨在提供,也不構成TradingView提供或認可的任何形式的財務、投資、交易或其他類型的建議或推薦。請閱讀使用條款以了解更多資訊。