OPEN-SOURCE SCRIPT
FRESH Weekly Regime - 4H
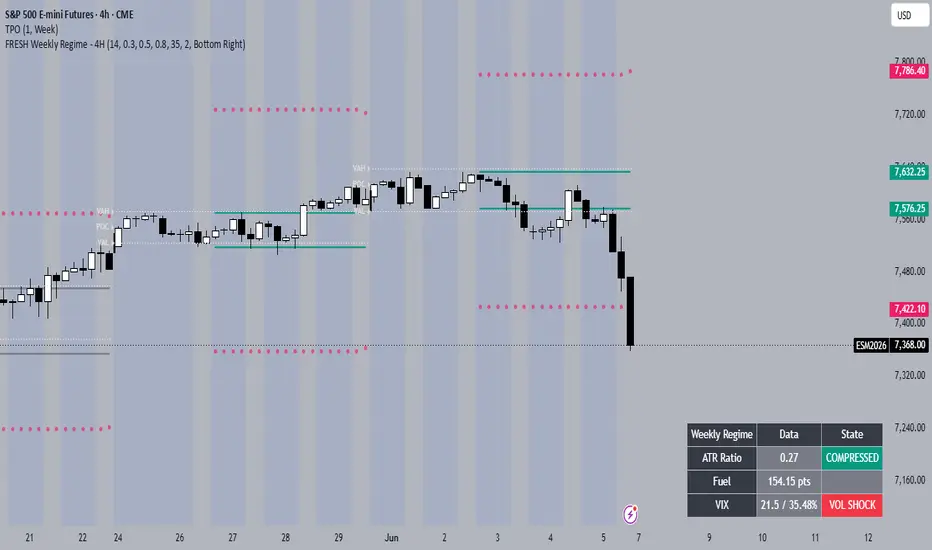
FRESH Weekly Regime (4H)
Higher‑timeframe context in one glance: how much of the week's expected range is already used, and how much is left.
What it does
It measures the weekly opening range (the week's Initial Balance, captured from the Sunday/Globex open through early Tuesday) and compares it to the weekly ATR:
Why I built it
My intraday read kept missing the bigger frame: a setup looks great until you realize the week has already run most of its average range (little fuel left) — or that it's coiled with room to run. This puts that weekly context on the chart so lower‑timeframe trades are taken with the week's position in mind.
How to read it
Notes
by oxkit (kitar.co/fresh)
Higher‑timeframe context in one glance: how much of the week's expected range is already used, and how much is left.
What it does
It measures the weekly opening range (the week's Initial Balance, captured from the Sunday/Globex open through early Tuesday) and compares it to the weekly ATR:
- ATR Ratio = weekly range ÷ weekly ATR → a regime read: COMPRESSED → BALANCED → EXPANDED → STRETCHED.
- Fuel = weekly ATR − weekly range = the points of "average week" still unspent.
- Walls = the opening‑range high/low projected outward by that Fuel — i.e. where a full average‑volatility week would reach (projected weekly extremes).
- A VIX state (VOL CRUSH / STABLE / RISING / SHOCK) for the volatility backdrop, and a summary dashboard.
Why I built it
My intraday read kept missing the bigger frame: a setup looks great until you realize the week has already run most of its average range (little fuel left) — or that it's coiled with room to run. This puts that weekly context on the chart so lower‑timeframe trades are taken with the week's position in mind.
How to read it
- COMPRESSED / low ratio → lots of Fuel, walls sit far away → the week has room to expand; favor continuation/breakout toward the walls.
- STRETCHED / high ratio → little Fuel, the week has used most of its average range → expect slowing or mean‑reversion; the walls become exhaustion zones rather than targets.
- Walls act as projected weekly range boundaries — magnets in an expanding week, fade zones in a stretched one (read the context).
- VIX frames it: high/rising vol widens what "normal" is; a crush tightens it.
Notes
- Designed for the 4‑hour chart (it reads weekly data - 4H is the intended view).
- Built for ES / index futures (a VIX‑style series is used for the volatility state).
- Levels reset each week. Context/education tool - not financial advice.
by oxkit (kitar.co/fresh)
開源腳本
秉持TradingView一貫精神,這個腳本的創作者將其設為開源,以便交易者檢視並驗證其功能。向作者致敬!您可以免費使用此腳本,但請注意,重新發佈代碼需遵守我們的社群規範。

免責聲明
這些資訊和出版物並非旨在提供,也不構成TradingView提供或認可的任何形式的財務、投資、交易或其他類型的建議或推薦。請閱讀使用條款以了解更多資訊。
免責聲明
這些資訊和出版物並非旨在提供,也不構成TradingView提供或認可的任何形式的財務、投資、交易或其他類型的建議或推薦。請閱讀使用條款以了解更多資訊。