PROTECTED SOURCE SCRIPT
TradeX Guru: Trap Hunter
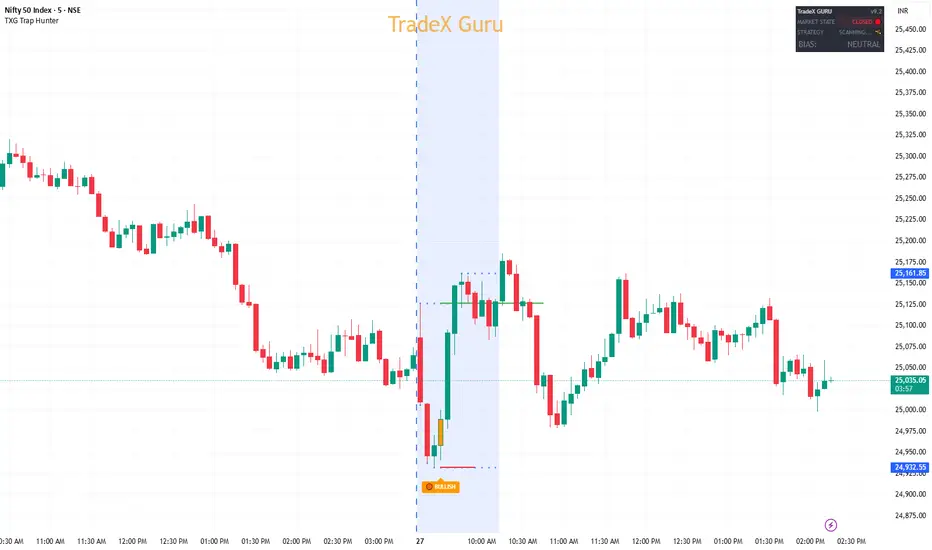
"We don't chase price. We set traps."
Most retail traders get slaughtered in the first hour of the market (09:15 – 10:15) because they chase "Fake Breakouts." They see a green candle breaking the high and buy immediately—only to watch the price reverse instantly.
The TradeX Trap Hunter is an institutional-grade algorithm designed to identify these Liquidity Traps. It visualizes where "Smart Money" is hunting stop-losses and helps you trade with the institutions, not against them.
🧠 The Logic: Anatomy of a Trap
The algorithm does not use lagging indicators like MACD or RSI. It uses pure Price Action & Time. It scans the "Kill Zone" (Volatility Window) for a specific 3-step institutional pattern:
The Lure (Liquidity Grab): Price breaks the Morning High or Low. This lures in aggressive breakout traders and triggers the Stop Losses of early reversals. This creates a pool of "Liquidity."
The Trap (Rejection): Instead of continuing, the price fails to hold the level and closes back inside the range. This proves the breakout was fake.
The Kill (Momentum Shift): A momentum candle breaks the structure of the trap candle. This is the confirmation that the reversal is real.
🚦 Visual Signal System (Traffic Light Logic)
The indicator uses a color-coded system to guide your discipline.
⚪ WAIT (Grey Label):
Status: A Trap has been detected.
Action: DO NOTHING. The market is baiting you. Wait for confirmation.
🟣 BEARISH BIAS (Purple Candle):
Status: The "Floor" of the trap candle has been broken by a close.
Meaning: Sellers have trapped the buyers at the top. Momentum is Down.
🟠 BULLISH BIAS (Orange Candle):
Status: The "Ceiling" of the trap candle has been broken by a close.
Meaning: Buyers have trapped the sellers at the bottom. Momentum is Up.
🛡️ Auto-Pilot Risk Management
The moment a signal is confirmed (Purple/Orange), the algorithm automatically calculates and draws your trade parameters on the chart:
🔴 Red Line (Invalidation): Placed at the High/Low of the trap. If price crosses this, the setup is failed.
🟢 Green Line (Target): Placed at the opposing side of the session range. This is where the liquidity is waiting.
💻 The Institutional Dashboard
A premium "Heads-Up Display" keeps you focused on the current session status.
Market State: Alerts you if the "Kill Zone" (09:15-10:15) is OPEN or CLOSED.
Strategy Status: Tells you if the algo is "Scanning," "Pending Confirmation," or "Active."
Current Bias: Displays the real-time direction (Bullish/Bearish) only when confirmed.
⚙️ Customizable Hunter Settings
1. Session Settings
Volatility Window: Default is 0915-1015 (Best for Nifty/BankNifty).
Crypto/Forex Users: Change this to the London or New York Open time.
2. Strict Filters (The Teacher Mode)
✅ Require Candle Break (Default: ON): This is the "Safety Filter." The signal will NOT fire unless a candle explicitly closes past the trap's wick. This filters out weak reversals.
☑️ Require Volume Spike (Optional): If enabled, the algorithm will ignore traps that occur on low volume, ensuring only high-participation moves are signaled.
📋 Best Practices
Timeframe: Optimized for 5-minute charts. (Can be used on 3m or 15m).
Assets: Works best on High-Liquidity instruments like BankNifty, Nifty 50, and F&O Stocks.
Discipline: Never enter on the Grey Label. Always wait for the Candle Color Change.
Disclaimer: This tool is for educational market analysis only. It highlights price action concepts (Traps & Momentum) and does not guarantee future results. Trading involves significant risk.
Most retail traders get slaughtered in the first hour of the market (09:15 – 10:15) because they chase "Fake Breakouts." They see a green candle breaking the high and buy immediately—only to watch the price reverse instantly.
The TradeX Trap Hunter is an institutional-grade algorithm designed to identify these Liquidity Traps. It visualizes where "Smart Money" is hunting stop-losses and helps you trade with the institutions, not against them.
🧠 The Logic: Anatomy of a Trap
The algorithm does not use lagging indicators like MACD or RSI. It uses pure Price Action & Time. It scans the "Kill Zone" (Volatility Window) for a specific 3-step institutional pattern:
The Lure (Liquidity Grab): Price breaks the Morning High or Low. This lures in aggressive breakout traders and triggers the Stop Losses of early reversals. This creates a pool of "Liquidity."
The Trap (Rejection): Instead of continuing, the price fails to hold the level and closes back inside the range. This proves the breakout was fake.
The Kill (Momentum Shift): A momentum candle breaks the structure of the trap candle. This is the confirmation that the reversal is real.
🚦 Visual Signal System (Traffic Light Logic)
The indicator uses a color-coded system to guide your discipline.
⚪ WAIT (Grey Label):
Status: A Trap has been detected.
Action: DO NOTHING. The market is baiting you. Wait for confirmation.
🟣 BEARISH BIAS (Purple Candle):
Status: The "Floor" of the trap candle has been broken by a close.
Meaning: Sellers have trapped the buyers at the top. Momentum is Down.
🟠 BULLISH BIAS (Orange Candle):
Status: The "Ceiling" of the trap candle has been broken by a close.
Meaning: Buyers have trapped the sellers at the bottom. Momentum is Up.
🛡️ Auto-Pilot Risk Management
The moment a signal is confirmed (Purple/Orange), the algorithm automatically calculates and draws your trade parameters on the chart:
🔴 Red Line (Invalidation): Placed at the High/Low of the trap. If price crosses this, the setup is failed.
🟢 Green Line (Target): Placed at the opposing side of the session range. This is where the liquidity is waiting.
💻 The Institutional Dashboard
A premium "Heads-Up Display" keeps you focused on the current session status.
Market State: Alerts you if the "Kill Zone" (09:15-10:15) is OPEN or CLOSED.
Strategy Status: Tells you if the algo is "Scanning," "Pending Confirmation," or "Active."
Current Bias: Displays the real-time direction (Bullish/Bearish) only when confirmed.
⚙️ Customizable Hunter Settings
1. Session Settings
Volatility Window: Default is 0915-1015 (Best for Nifty/BankNifty).
Crypto/Forex Users: Change this to the London or New York Open time.
2. Strict Filters (The Teacher Mode)
✅ Require Candle Break (Default: ON): This is the "Safety Filter." The signal will NOT fire unless a candle explicitly closes past the trap's wick. This filters out weak reversals.
☑️ Require Volume Spike (Optional): If enabled, the algorithm will ignore traps that occur on low volume, ensuring only high-participation moves are signaled.
📋 Best Practices
Timeframe: Optimized for 5-minute charts. (Can be used on 3m or 15m).
Assets: Works best on High-Liquidity instruments like BankNifty, Nifty 50, and F&O Stocks.
Discipline: Never enter on the Grey Label. Always wait for the Candle Color Change.
Disclaimer: This tool is for educational market analysis only. It highlights price action concepts (Traps & Momentum) and does not guarantee future results. Trading involves significant risk.
受保護腳本
此腳本以閉源形式發佈。 不過,您可以自由使用,沒有任何限制 — 點擊此處了解更多。

TradeX Guru | Institutional Scalping Systems 🛡️ 🚀 Get Full Access & Join Our Community: [Whop Store]whop.com/txg-indicator/
[Superprofile Bio]superprofile.bio/vp/tradex-guru-indicator 📩 Contact: tradexguru1@gmail.com
tradexguru.in
[Superprofile Bio]superprofile.bio/vp/tradex-guru-indicator 📩 Contact: tradexguru1@gmail.com
tradexguru.in
免責聲明
這些資訊和出版物並非旨在提供,也不構成TradingView提供或認可的任何形式的財務、投資、交易或其他類型的建議或推薦。請閱讀使用條款以了解更多資訊。
受保護腳本
此腳本以閉源形式發佈。 不過,您可以自由使用,沒有任何限制 — 點擊此處了解更多。
TradeX Guru | Institutional Scalping Systems 🛡️ 🚀 Get Full Access & Join Our Community: [Whop Store]whop.com/txg-indicator/
[Superprofile Bio]superprofile.bio/vp/tradex-guru-indicator 📩 Contact: tradexguru1@gmail.com
tradexguru.in
[Superprofile Bio]superprofile.bio/vp/tradex-guru-indicator 📩 Contact: tradexguru1@gmail.com
tradexguru.in
免責聲明
這些資訊和出版物並非旨在提供,也不構成TradingView提供或認可的任何形式的財務、投資、交易或其他類型的建議或推薦。請閱讀使用條款以了解更多資訊。