已更新
Structure Hunter - Market Structure & Chart Patterns
===================== BAŞLIK / TITLE =====================
Structure Hunter - Market Structure & Chart Patterns
===================== ENGLISH =====================
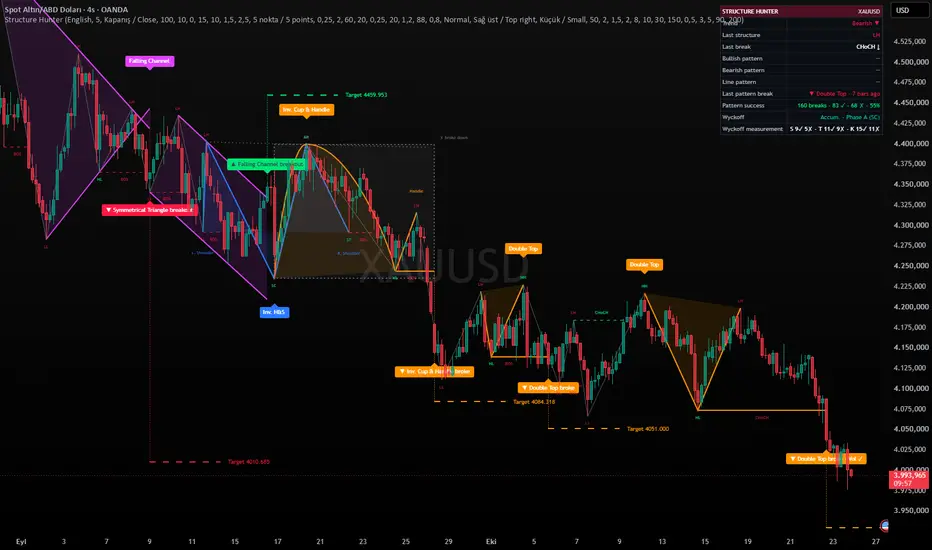
Structure Hunter combines zigzag-based market structure with automatic detection of classic chart patterns. Each pattern is drawn from confirmed swing points, tracked until its neckline or trendline breaks, and then given a measured-move target. It is a charting and context tool; it does not open trades or generate buy/sell signals on its own.
HOW IT WORKS
1. Market structure
Swing highs and lows are confirmed with a pivot of N bars on each side (Swing length). From these swings the script draws a zigzag, labels each swing as HH / HL / LH / LL and marks structure breaks:
- BOS (break of structure): a close (or wick, selectable) beyond the last swing in the direction of the current trend.
- CHoCH (change of character): the first break against the current trend.
2. Reversal patterns (neckline based)
- Head & Shoulders / Inverse Head & Shoulders
- Triple Top / Triple Bottom
- Double Top / Double Bottom
- Cup & Handle / Inverse Cup & Handle
The last 3 to 5 zigzag points are tested for shape, level tolerance (as a % of pattern height), minimum height (ATR), time symmetry and, optionally, a prior trend. When a pattern is found, its neckline is drawn and extended bar by bar.
3. Line patterns (two trendlines)
- Ascending / Descending / Symmetrical Triangle
- Rising / Falling Wedge
- Rectangle
- Rising / Falling Channel
- Bull / Bear Flag and Bull / Bear Pennant (a channel, rectangle or symmetrical triangle that follows a sharp pole)
- Broadening pattern (off by default)
Two trendlines are fitted through the last 4 or 5 alternating swings. The pattern is named from the slope of each line (flat / up / down) and from whether the lines converge or stay parallel. With the 5-point option, the middle touch must also sit on its line, which filters out loose fits.
4. Breaks and targets
A pattern counts as broken only when a candle closes beyond the neckline / trendline. A break label is then drawn together with a measured-move target: pattern height for reversal patterns and line patterns, pole length for flags and pennants. A pattern is invalidated (gray, dotted) if price closes beyond the head / peak, if the triangle or wedge reaches its apex, or if no break comes within the set number of bars.
5. Clean chart
- Only the last N patterns stay on the chart (default 10). Each pattern's drawing, break label and target are deleted together when it drops out.
- Swing labels and BOS / CHoCH are also capped.
- Swing points already used by a reversal pattern are not reused by a line pattern, so the same move is not counted twice.
INFO TABLE
Trend, last structure, last break, the active bullish / bearish reversal pattern with its current neckline price, the active line pattern and the last pattern break.
ALERTS
BOS ↑ / ↓, CHoCH ↑ / ↓, Pattern formed, Pattern broke up, Pattern broke down. With "Any alert() function call" you get a detailed message with the pattern name, neckline and target price.
LANGUAGE
Chart texts, table and alert messages are available in Turkish and English (General → Language).
REPAINTING AND LIMITATIONS
- A swing is confirmed only after "Swing length" bars, so swing labels and patterns appear with that delay, placed back on the bar where the swing occurred. This is how pivots work, not repainting.
- With "Wait for bar close" on (default), swings, breaks and patterns are final on closed candles. If you turn it off, they can appear on the open candle and disappear when it closes.
- Pattern recognition is rule based and simplified. Not every textbook pattern will be found, and some detected patterns will fail. Targets are classic measured-move estimates, not predictions.
- Larger "Pattern swing length" values find fewer but bigger patterns. Lower "Level tolerance" values give fewer but cleaner patterns.
This script is for educational and analytical purposes only and is not financial advice.
===================== TÜRKÇE =====================
Structure Hunter, zigzag tabanlı piyasa yapısını klasik grafik formasyonlarının otomatik tespitiyle birleştirir. Her formasyon onaylanmış swing noktalarından çizilir, boyun veya trend çizgisi kırılana kadar takip edilir ve kırılımda ölçülen hareket hedefi gösterilir. Bir grafik ve bağlam aracıdır; kendi başına işlem açmaz, AL/SAT sinyali üretmez.
NASIL ÇALIŞIR
1. Piyasa yapısı
Tepe ve dipler, her iki yanda N bar olan pivotla onaylanır (Swing uzunluğu). Bu swinglerden zigzag çizilir, her swing HH / HL / LH / LL olarak etiketlenir ve yapı kırılımları işaretlenir:
- BOS (yapı kırılımı): trend yönünde son swingin ötesinde kapanış (veya seçilirse fitil).
- CHoCH (karakter değişimi): mevcut trendin tersine ilk kırılım.
2. Dönüş formasyonları (boyun çizgili)
- Omuz-Baş-Omuz (OBO) / Ters Omuz-Baş-Omuz (TOBO)
- Üçlü Tepe / Üçlü Dip
- İkili Tepe / İkili Dip
- Fincan-Kulp / Ters Fincan-Kulp
Son 3-5 zigzag noktası şekil, seviye toleransı (formasyon boyunun %'si), minimum boy (ATR), zaman simetrisi ve isteğe bağlı olarak öncesindeki trend açısından test edilir. Formasyon bulununca boyun çizgisi çizilir ve her barda uzatılır.
3. Çizgi formasyonları (iki trend çizgisi)
- Yükselen / Alçalan / Simetrik Üçgen
- Yükselen / Alçalan Takoz
- Dikdörtgen
- Yükselen / Düşen Kanal
- Boğa / Ayı Bayrağı ve Boğa / Ayı Flaması (sert bir direkten sonra gelen kanal, dikdörtgen veya simetrik üçgen)
- Genişleyen formasyon (varsayılan kapalı)
Son 4 veya 5 ardışık swingden iki trend çizgisi geçirilir. Formasyon, her çizginin eğimine (yatay / yukarı / aşağı) ve çizgilerin daralıp daralmadığına göre adlandırılır. 5 nokta seçeneğinde ortadaki dokunuşun da çizgi üzerinde olması gerekir; bu, gevşek eşleşmeleri eler.
4. Kırılım ve hedef
Formasyon ancak bir mum boyun / trend çizgisinin ötesinde kapanınca kırılmış sayılır. Kırılım etiketiyle birlikte ölçülen hareket hedefi çizilir: dönüş ve çizgi formasyonlarında formasyon yüksekliği, bayrak ve flamada direk boyu kadar. Fiyat baş / tepe seviyesinin ötesinde kapanırsa, üçgen veya takoz tepe noktasına ulaşırsa ya da belirlenen bar sayısı içinde kırılım gelmezse formasyon geçersiz sayılır (gri, noktalı).
5. Sade grafik
- Grafikte sadece son N formasyon kalır (varsayılan 10). Listeden düşen formasyonun çizimi, kırılım etiketi ve hedefi birlikte silinir.
- Swing etiketleri ve BOS / CHoCH sayısı da sınırlıdır.
- Bir dönüş formasyonunda kullanılan swing noktaları çizgi formasyonunda tekrar kullanılmaz; aynı hareket iki kez sayılmaz.
BİLGİ TABLOSU
Trend, son yapı, son kırılım, aktif yükseliş / düşüş formasyonu ve güncel boyun fiyatı, aktif çizgi formasyonu ve son formasyon kırılımı.
ALARMLAR
BOS ↑ / ↓, CHoCH ↑ / ↓, Formasyon oluştu, Formasyon yukarı kırıldı, Formasyon aşağı kırıldı. "Herhangi bir alert() çağrısı" ile formasyon adı, boyun ve hedef fiyatını içeren ayrıntılı mesaj gelir.
DİL
Grafikteki yazılar, tablo ve alarm mesajları Türkçe ve İngilizce kullanılabilir (Genel → Dil).
REPAINT VE SINIRLAR
- Bir swing ancak "Swing uzunluğu" kadar bar sonra onaylanır; bu yüzden swing etiketleri ve formasyonlar bu gecikmeyle, swingin oluştuğu bara geriye doğru çizilir. Bu pivotların doğası gereğidir, repaint değildir.
- "Bar kapanışını bekle" açıkken (varsayılan) swing, kırılım ve formasyonlar kapanmış mumda kesinleşir. Kapatılırsa açık mumda görünüp mum kapanınca kaybolabilir.
- Formasyon tanıma kural tabanlı ve sadeleştirilmiştir. Ders kitabındaki her formasyon bulunmaz ve bulunan formasyonların bir kısmı başarısız olur. Hedefler klasik ölçülen hareket tahminleridir, kehanet değildir.
- "Formasyon swing uzunluğu" büyüdükçe daha az ama daha büyük formasyon bulunur. "Seviye toleransı" küçüldükçe daha az ama daha temiz formasyon çıkar.
Bu script yalnızca eğitim ve analiz amaçlıdır, yatırım tavsiyesi değildir.
Structure Hunter - Market Structure & Chart Patterns
===================== ENGLISH =====================
Structure Hunter combines zigzag-based market structure with automatic detection of classic chart patterns. Each pattern is drawn from confirmed swing points, tracked until its neckline or trendline breaks, and then given a measured-move target. It is a charting and context tool; it does not open trades or generate buy/sell signals on its own.
HOW IT WORKS
1. Market structure
Swing highs and lows are confirmed with a pivot of N bars on each side (Swing length). From these swings the script draws a zigzag, labels each swing as HH / HL / LH / LL and marks structure breaks:
- BOS (break of structure): a close (or wick, selectable) beyond the last swing in the direction of the current trend.
- CHoCH (change of character): the first break against the current trend.
2. Reversal patterns (neckline based)
- Head & Shoulders / Inverse Head & Shoulders
- Triple Top / Triple Bottom
- Double Top / Double Bottom
- Cup & Handle / Inverse Cup & Handle
The last 3 to 5 zigzag points are tested for shape, level tolerance (as a % of pattern height), minimum height (ATR), time symmetry and, optionally, a prior trend. When a pattern is found, its neckline is drawn and extended bar by bar.
3. Line patterns (two trendlines)
- Ascending / Descending / Symmetrical Triangle
- Rising / Falling Wedge
- Rectangle
- Rising / Falling Channel
- Bull / Bear Flag and Bull / Bear Pennant (a channel, rectangle or symmetrical triangle that follows a sharp pole)
- Broadening pattern (off by default)
Two trendlines are fitted through the last 4 or 5 alternating swings. The pattern is named from the slope of each line (flat / up / down) and from whether the lines converge or stay parallel. With the 5-point option, the middle touch must also sit on its line, which filters out loose fits.
4. Breaks and targets
A pattern counts as broken only when a candle closes beyond the neckline / trendline. A break label is then drawn together with a measured-move target: pattern height for reversal patterns and line patterns, pole length for flags and pennants. A pattern is invalidated (gray, dotted) if price closes beyond the head / peak, if the triangle or wedge reaches its apex, or if no break comes within the set number of bars.
5. Clean chart
- Only the last N patterns stay on the chart (default 10). Each pattern's drawing, break label and target are deleted together when it drops out.
- Swing labels and BOS / CHoCH are also capped.
- Swing points already used by a reversal pattern are not reused by a line pattern, so the same move is not counted twice.
INFO TABLE
Trend, last structure, last break, the active bullish / bearish reversal pattern with its current neckline price, the active line pattern and the last pattern break.
ALERTS
BOS ↑ / ↓, CHoCH ↑ / ↓, Pattern formed, Pattern broke up, Pattern broke down. With "Any alert() function call" you get a detailed message with the pattern name, neckline and target price.
LANGUAGE
Chart texts, table and alert messages are available in Turkish and English (General → Language).
REPAINTING AND LIMITATIONS
- A swing is confirmed only after "Swing length" bars, so swing labels and patterns appear with that delay, placed back on the bar where the swing occurred. This is how pivots work, not repainting.
- With "Wait for bar close" on (default), swings, breaks and patterns are final on closed candles. If you turn it off, they can appear on the open candle and disappear when it closes.
- Pattern recognition is rule based and simplified. Not every textbook pattern will be found, and some detected patterns will fail. Targets are classic measured-move estimates, not predictions.
- Larger "Pattern swing length" values find fewer but bigger patterns. Lower "Level tolerance" values give fewer but cleaner patterns.
This script is for educational and analytical purposes only and is not financial advice.
===================== TÜRKÇE =====================
Structure Hunter, zigzag tabanlı piyasa yapısını klasik grafik formasyonlarının otomatik tespitiyle birleştirir. Her formasyon onaylanmış swing noktalarından çizilir, boyun veya trend çizgisi kırılana kadar takip edilir ve kırılımda ölçülen hareket hedefi gösterilir. Bir grafik ve bağlam aracıdır; kendi başına işlem açmaz, AL/SAT sinyali üretmez.
NASIL ÇALIŞIR
1. Piyasa yapısı
Tepe ve dipler, her iki yanda N bar olan pivotla onaylanır (Swing uzunluğu). Bu swinglerden zigzag çizilir, her swing HH / HL / LH / LL olarak etiketlenir ve yapı kırılımları işaretlenir:
- BOS (yapı kırılımı): trend yönünde son swingin ötesinde kapanış (veya seçilirse fitil).
- CHoCH (karakter değişimi): mevcut trendin tersine ilk kırılım.
2. Dönüş formasyonları (boyun çizgili)
- Omuz-Baş-Omuz (OBO) / Ters Omuz-Baş-Omuz (TOBO)
- Üçlü Tepe / Üçlü Dip
- İkili Tepe / İkili Dip
- Fincan-Kulp / Ters Fincan-Kulp
Son 3-5 zigzag noktası şekil, seviye toleransı (formasyon boyunun %'si), minimum boy (ATR), zaman simetrisi ve isteğe bağlı olarak öncesindeki trend açısından test edilir. Formasyon bulununca boyun çizgisi çizilir ve her barda uzatılır.
3. Çizgi formasyonları (iki trend çizgisi)
- Yükselen / Alçalan / Simetrik Üçgen
- Yükselen / Alçalan Takoz
- Dikdörtgen
- Yükselen / Düşen Kanal
- Boğa / Ayı Bayrağı ve Boğa / Ayı Flaması (sert bir direkten sonra gelen kanal, dikdörtgen veya simetrik üçgen)
- Genişleyen formasyon (varsayılan kapalı)
Son 4 veya 5 ardışık swingden iki trend çizgisi geçirilir. Formasyon, her çizginin eğimine (yatay / yukarı / aşağı) ve çizgilerin daralıp daralmadığına göre adlandırılır. 5 nokta seçeneğinde ortadaki dokunuşun da çizgi üzerinde olması gerekir; bu, gevşek eşleşmeleri eler.
4. Kırılım ve hedef
Formasyon ancak bir mum boyun / trend çizgisinin ötesinde kapanınca kırılmış sayılır. Kırılım etiketiyle birlikte ölçülen hareket hedefi çizilir: dönüş ve çizgi formasyonlarında formasyon yüksekliği, bayrak ve flamada direk boyu kadar. Fiyat baş / tepe seviyesinin ötesinde kapanırsa, üçgen veya takoz tepe noktasına ulaşırsa ya da belirlenen bar sayısı içinde kırılım gelmezse formasyon geçersiz sayılır (gri, noktalı).
5. Sade grafik
- Grafikte sadece son N formasyon kalır (varsayılan 10). Listeden düşen formasyonun çizimi, kırılım etiketi ve hedefi birlikte silinir.
- Swing etiketleri ve BOS / CHoCH sayısı da sınırlıdır.
- Bir dönüş formasyonunda kullanılan swing noktaları çizgi formasyonunda tekrar kullanılmaz; aynı hareket iki kez sayılmaz.
BİLGİ TABLOSU
Trend, son yapı, son kırılım, aktif yükseliş / düşüş formasyonu ve güncel boyun fiyatı, aktif çizgi formasyonu ve son formasyon kırılımı.
ALARMLAR
BOS ↑ / ↓, CHoCH ↑ / ↓, Formasyon oluştu, Formasyon yukarı kırıldı, Formasyon aşağı kırıldı. "Herhangi bir alert() çağrısı" ile formasyon adı, boyun ve hedef fiyatını içeren ayrıntılı mesaj gelir.
DİL
Grafikteki yazılar, tablo ve alarm mesajları Türkçe ve İngilizce kullanılabilir (Genel → Dil).
REPAINT VE SINIRLAR
- Bir swing ancak "Swing uzunluğu" kadar bar sonra onaylanır; bu yüzden swing etiketleri ve formasyonlar bu gecikmeyle, swingin oluştuğu bara geriye doğru çizilir. Bu pivotların doğası gereğidir, repaint değildir.
- "Bar kapanışını bekle" açıkken (varsayılan) swing, kırılım ve formasyonlar kapanmış mumda kesinleşir. Kapatılırsa açık mumda görünüp mum kapanınca kaybolabilir.
- Formasyon tanıma kural tabanlı ve sadeleştirilmiştir. Ders kitabındaki her formasyon bulunmaz ve bulunan formasyonların bir kısmı başarısız olur. Hedefler klasik ölçülen hareket tahminleridir, kehanet değildir.
- "Formasyon swing uzunluğu" büyüdükçe daha az ama daha büyük formasyon bulunur. "Seviye toleransı" küçüldükçe daha az ama daha temiz formasyon çıkar.
Bu script yalnızca eğitim ve analiz amaçlıdır, yatırım tavsiyesi değildir.
發行說明
mobil panel add發行說明
v3.1 updateNew
- Pattern success statistics: every broken pattern in the loaded history is now tracked. It counts as successful (✓) if price reaches the measured-move target, and as failed (✗) if price first closes back beyond the pattern (head / peak for reversal patterns, the opposite trendline for line patterns). If both happen on the same candle, it counts as failed. The table shows breaks, ✓, ✗ and the success rate. Hover over the row for a breakdown by pattern type, volume-confirmed vs. unconfirmed breaks, and the number of patterns invalidated before a break. These figures describe the loaded history of the current symbol and timeframe only; they are not a forecast.
- Retest label: if price returns to the broken neckline / trendline within the retest window and closes back in the break direction, a "Retest ✓" label is drawn. A new "Retest" alert condition is also available.
- Volume confirmation: if the break candle's volume is above its average (MA x multiplier), the break label and alert message show "Vol ✓". Ignored on symbols without volume data.
Improved
- Flag / pennant detection: if the first leg of a line pattern is much larger than the others, its starting point is treated as the base of a pole instead of a trendline touch. Flags and pennants are no longer mislabeled as triangles.
- Mobile panel now has 5 rows and includes the success statistics.
All new features can be turned on or off individually under "3 · Patterns".
發行說明
v3.4 update- Cup & handle is now drawn as a smooth arch through the pattern's real high / low, with no jagged steps. New "Cup roundness" setting: lower = fuller dome, higher = sharper.
- Optional light background fill for all patterns, with adjustable transparency (can be turned off).
發行說明
v3.8 — Wyckoff SchematicsNEW: Wyckoff accumulation / distribution module (Settings → 5 · Wyckoff)
• Detects trading ranges after a climax: SC / BC → AR → ST → Spring / UTAD → SOS / SOW → LPS / LPSY, drawn as a box with event labels.
• Phase status in the info table (e.g. "Accum. · Phase C (Spring)").
• BUY only on an SOS that follows a Spring; SELL only on an SOW that follows a UTAD. Measured-move target drawn on the chart.
• Invalidated ranges turn gray with the reason ("✗ broke down" / "✗ timed out").
• Only one side at a time: an active range blocks opposite schematics.
• Wyckoff signals are included in the "Pattern success" statistic.
• New alerts: Wyckoff Spring, Wyckoff UTAD, Wyckoff BUY (SOS), Wyckoff SELL (SOW).
NEW: Wyckoff measurement row
Every SOS / SOW is scored on the loaded history, whether it gave a signal or not (✓ measured target · ✗ close beyond the climax), in three groups:
S = with Spring / UTAD · T = without, in the trend direction · K = without, against the trend (trend = close vs EMA 200).
On our test set (11 charts: BIST daily, crypto and gold 4H) group S reached the target ~81% of the time (37 cases), while T and K stayed near 50–56%. This is why signals require a Spring / UTAD. Check the row on your own symbol — past results do not guarantee future results.
No changes to market structure or chart pattern logic. Works on the free (Basic) plan.
發行說明
v3.9 — Deeper Spring / UTAD• Wyckoff: Spring / UTAD max depth default 0.25 → 0.50 (Settings → 5 · Wyckoff).
Tested on gold, BTC, ETH and SOL 4H with the built-in measurement row:
0.25 → 25 Spring/UTAD-confirmed breaks, 80% reached target
0.50 → 46 breaks, 72% reached target (new cases 62%)
Fewer perfect signals per case, but nearly twice as many and a higher total. Set it back to 0.25 if you prefer only the cleanest setups.
• Note: since v3.8 the optional Wyckoff module shows BUY / SELL labels (SOS after a Spring, SOW after a UTAD). Everything else remains structure and pattern context; the script does not place trades.

免責聲明
這些資訊和出版物並非旨在提供,也不構成TradingView提供或認可的任何形式的財務、投資、交易或其他類型的建議或推薦。請閱讀使用條款以了解更多資訊。
免責聲明
這些資訊和出版物並非旨在提供,也不構成TradingView提供或認可的任何形式的財務、投資、交易或其他類型的建議或推薦。請閱讀使用條款以了解更多資訊。