OPEN-SOURCE SCRIPT
Gaspard98 - RSI Glissant
# Gaspard98 ⊛ RSI Glissant — Sliding RSI projected on price
## Overview
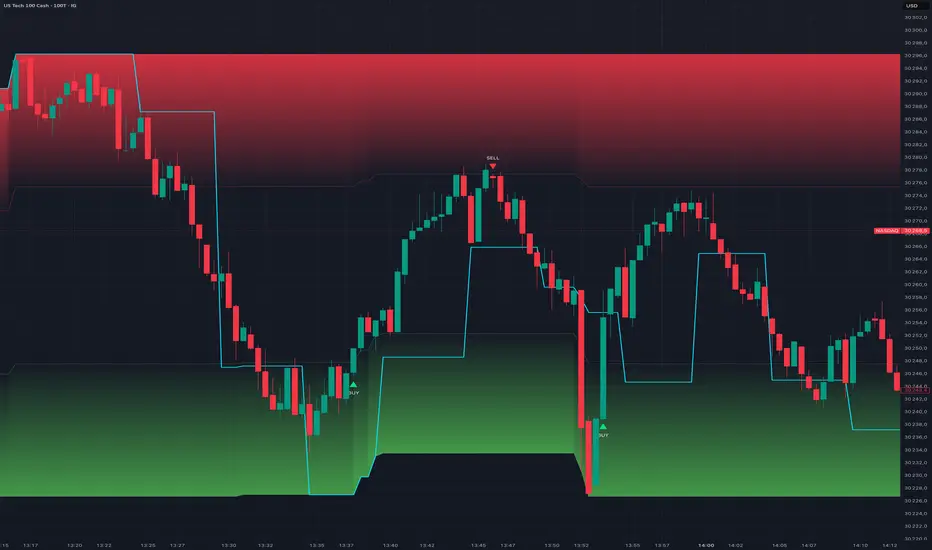
**RSI Glissant** ("Sliding RSI") is an on-chart overlay that takes a multi-timeframe RSI, re-scales it dynamically over a rolling window, and projects the result directly onto the price band. Instead of reading an oscillator in a separate sub-pane, you see an adaptive RSI curve riding inside the recent high/low range of price, with overbought and overload zones drawn as price levels you can actually trade against.
The goal is simple: keep your eyes on price, but with RSI context built into the chart itself.
---
## Concept — why "sliding"
A classic RSI moves between 0 and 100 against fixed thresholds. The problem is that in trending or low-volatility regimes the raw RSI rarely reaches those extremes, so 70/30 stop being meaningful.
This indicator solves that with two layers:
1. **Adaptive normalization.** The raw MTF RSI is re-normalized to a 0–100 scale over its own rolling range (the *Sliding Range*). The highest and lowest RSI readings of the lookback window become the new 100 and 0. The oscillator therefore always "breathes" across the full scale and stays responsive to the current regime.
2. **Projection onto price.** That normalized curve is then mapped onto the price band — defined by the highest high and lowest low of the same rolling window. A value of 0 sits on the band floor, 100 on the band ceiling. The overbought (default 70) and oversold (default 30) thresholds become two horizontal **price levels**, not abstract oscillator lines.
The result is a cyan curve and two zone lines that live on the candles, scaling automatically as the market range expands or contracts.
---
## Signals
Signals are triggered by **price closing back through the projected zone lines**, which keeps them anchored to actual price action rather than to the oscillator alone:
- **BUY** — price closes back **above** the projected oversold level (exit from the lower/green zone).
- **SELL** — price closes back **below** the projected overbought level (exit from the upper/red zone).
This is a mean-reversion logic: the indicator looks for price leaving an extreme zone rather than simply touching it.
### Optional signal filters
- **Heikin Ashi confirmation** — BUY only fires on a green HA candle, SELL only on a red HA candle.
- **Strict alternation** — never two BUYs (or two SELLs) in a row; the system waits for an opposite signal before repeating.
- **All signals (no filter)** — shows every qualifying close, ignoring alternation and the HA filter, for testing or discretionary reading.
---
## Visuals
- **Cyan line** — the sliding RSI curve projected onto price.
- **Red / green guide lines** — the overbought and oversold thresholds projected onto price.
- **Gradient fill** — red intensifies above the overbought level, green intensifies below the oversold level, giving an instant read of how stretched price is inside its range.
- **BUY / SELL labels** — plotted on the bars that trigger.
---
## Settings
**RSI MTF**
- *Source* — price source for the RSI (default Close).
- *RSI Length* — RSI period (default 14).
- *RSI Timeframe* — the higher timeframe the RSI is computed on (default 5 min).
- *Anti-repaint* — see the repaint note below.
**OB / OS Zones**
- *Overbought level* (default 70) and *Oversold level* (default 30).
**Sliding Band**
- *Sliding Range (bars)* — lookback used for both the RSI re-normalization and the price band (default 150).
- *OB/OS guide lines* — show/hide the projected threshold lines.
- *Out-of-zone gradient* — show/hide the red/green fill.
**Signals**
- *Confirm with HA color*, *All signals*, *Strict BUY/SELL alternation* — as described above.
---
## How to use
1. Pick an RSI timeframe higher than your chart timeframe for cleaner context (e.g. 5 min RSI on a 1 min chart).
2. Adjust the *Sliding Range* to your style — shorter for reactive intraday work, longer for smoother swing context.
3. Treat the green/red zones as adaptive stretch zones: a BUY signal marks price leaving the lower zone, a SELL marks price leaving the upper zone.
4. Combine with your own trend filter or structure read — the signals are reversion-oriented and work best with confluence.
---
## Repaint disclosure
By default (*Anti-repaint* OFF), the indicator uses the live, in-progress value of the higher-timeframe RSI. While the current HTF bar is still forming, that value can change, so the most recent reading and signal **may repaint** until the HTF bar closes.
Turning *Anti-repaint* **ON** forces the indicator to use only the last **confirmed** higher-timeframe value (offset by one bar with `lookahead_off`). Signals are then non-repainting and confirmed, at the cost of being slightly later. Choose ON for honest backtesting and alert-driven workflows.
---
## Alerts
Two alert conditions are provided, **BUY — exit OS** and **SELL — exit OB**, plus built-in `alert()` calls that fire once per bar close. Set them to "Once per bar close" to match the indicator's confirmation logic.
---
## Disclaimer
This indicator is a technical analysis tool provided for educational and informational purposes only. It is not financial advice and does not guarantee any result. Past behavior of any signal does not predict future performance. Always do your own research and manage your own risk.
© Gaspard98
## Overview
**RSI Glissant** ("Sliding RSI") is an on-chart overlay that takes a multi-timeframe RSI, re-scales it dynamically over a rolling window, and projects the result directly onto the price band. Instead of reading an oscillator in a separate sub-pane, you see an adaptive RSI curve riding inside the recent high/low range of price, with overbought and overload zones drawn as price levels you can actually trade against.
The goal is simple: keep your eyes on price, but with RSI context built into the chart itself.
---
## Concept — why "sliding"
A classic RSI moves between 0 and 100 against fixed thresholds. The problem is that in trending or low-volatility regimes the raw RSI rarely reaches those extremes, so 70/30 stop being meaningful.
This indicator solves that with two layers:
1. **Adaptive normalization.** The raw MTF RSI is re-normalized to a 0–100 scale over its own rolling range (the *Sliding Range*). The highest and lowest RSI readings of the lookback window become the new 100 and 0. The oscillator therefore always "breathes" across the full scale and stays responsive to the current regime.
2. **Projection onto price.** That normalized curve is then mapped onto the price band — defined by the highest high and lowest low of the same rolling window. A value of 0 sits on the band floor, 100 on the band ceiling. The overbought (default 70) and oversold (default 30) thresholds become two horizontal **price levels**, not abstract oscillator lines.
The result is a cyan curve and two zone lines that live on the candles, scaling automatically as the market range expands or contracts.
---
## Signals
Signals are triggered by **price closing back through the projected zone lines**, which keeps them anchored to actual price action rather than to the oscillator alone:
- **BUY** — price closes back **above** the projected oversold level (exit from the lower/green zone).
- **SELL** — price closes back **below** the projected overbought level (exit from the upper/red zone).
This is a mean-reversion logic: the indicator looks for price leaving an extreme zone rather than simply touching it.
### Optional signal filters
- **Heikin Ashi confirmation** — BUY only fires on a green HA candle, SELL only on a red HA candle.
- **Strict alternation** — never two BUYs (or two SELLs) in a row; the system waits for an opposite signal before repeating.
- **All signals (no filter)** — shows every qualifying close, ignoring alternation and the HA filter, for testing or discretionary reading.
---
## Visuals
- **Cyan line** — the sliding RSI curve projected onto price.
- **Red / green guide lines** — the overbought and oversold thresholds projected onto price.
- **Gradient fill** — red intensifies above the overbought level, green intensifies below the oversold level, giving an instant read of how stretched price is inside its range.
- **BUY / SELL labels** — plotted on the bars that trigger.
---
## Settings
**RSI MTF**
- *Source* — price source for the RSI (default Close).
- *RSI Length* — RSI period (default 14).
- *RSI Timeframe* — the higher timeframe the RSI is computed on (default 5 min).
- *Anti-repaint* — see the repaint note below.
**OB / OS Zones**
- *Overbought level* (default 70) and *Oversold level* (default 30).
**Sliding Band**
- *Sliding Range (bars)* — lookback used for both the RSI re-normalization and the price band (default 150).
- *OB/OS guide lines* — show/hide the projected threshold lines.
- *Out-of-zone gradient* — show/hide the red/green fill.
**Signals**
- *Confirm with HA color*, *All signals*, *Strict BUY/SELL alternation* — as described above.
---
## How to use
1. Pick an RSI timeframe higher than your chart timeframe for cleaner context (e.g. 5 min RSI on a 1 min chart).
2. Adjust the *Sliding Range* to your style — shorter for reactive intraday work, longer for smoother swing context.
3. Treat the green/red zones as adaptive stretch zones: a BUY signal marks price leaving the lower zone, a SELL marks price leaving the upper zone.
4. Combine with your own trend filter or structure read — the signals are reversion-oriented and work best with confluence.
---
## Repaint disclosure
By default (*Anti-repaint* OFF), the indicator uses the live, in-progress value of the higher-timeframe RSI. While the current HTF bar is still forming, that value can change, so the most recent reading and signal **may repaint** until the HTF bar closes.
Turning *Anti-repaint* **ON** forces the indicator to use only the last **confirmed** higher-timeframe value (offset by one bar with `lookahead_off`). Signals are then non-repainting and confirmed, at the cost of being slightly later. Choose ON for honest backtesting and alert-driven workflows.
---
## Alerts
Two alert conditions are provided, **BUY — exit OS** and **SELL — exit OB**, plus built-in `alert()` calls that fire once per bar close. Set them to "Once per bar close" to match the indicator's confirmation logic.
---
## Disclaimer
This indicator is a technical analysis tool provided for educational and informational purposes only. It is not financial advice and does not guarantee any result. Past behavior of any signal does not predict future performance. Always do your own research and manage your own risk.
© Gaspard98
開源腳本
秉持TradingView一貫精神,這個腳本的創作者將其設為開源,以便交易者檢視並驗證其功能。向作者致敬!您可以免費使用此腳本,但請注意,重新發佈代碼需遵守我們的社群規範。

免責聲明
這些資訊和出版物並非旨在提供,也不構成TradingView提供或認可的任何形式的財務、投資、交易或其他類型的建議或推薦。請閱讀使用條款以了解更多資訊。
免責聲明
這些資訊和出版物並非旨在提供,也不構成TradingView提供或認可的任何形式的財務、投資、交易或其他類型的建議或推薦。請閱讀使用條款以了解更多資訊。