OPEN-SOURCE SCRIPT
已更新 Multiple MA Dashboard [PUCHON]
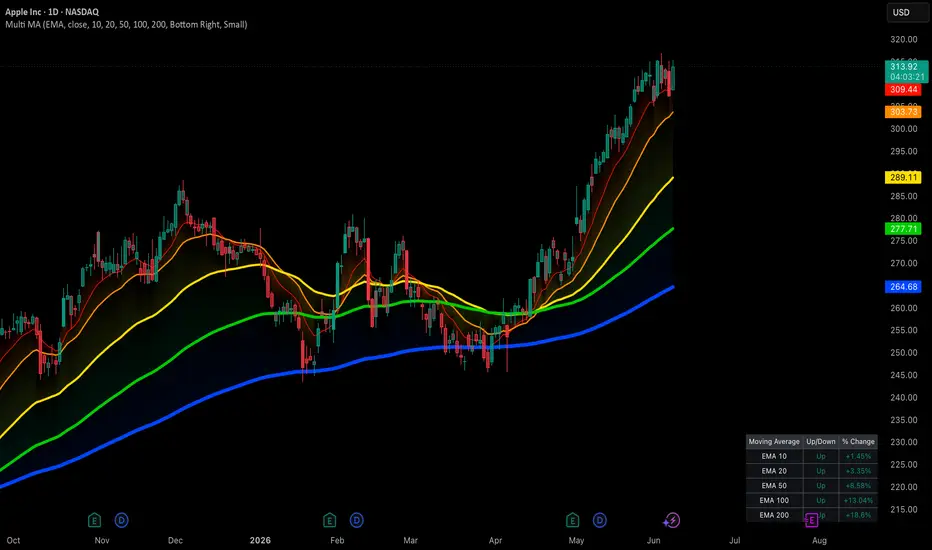
📊 Multiple MA Dashboard [PUCHON]
The Multiple MA Dashboard plots up to 5 moving averages of a chosen type (EMA, SMA, WMA, or RMA) directly on your chart and summarizes their relationship to price in a clean, real-time table. Instead of eyeballing where price sits relative to each average, this indicator gives you an instant Up/Down read and the exact percentage distance for every MA.
✨ Features:
- 📈 5 Configurable Moving Averages: Set independent lengths (defaults: 10, 20, 50, 100, 200) sharing one MA type and source.
- 🔁 Switchable MA Type: Choose between EMA, SMA, WMA, and RMA from a single dropdown — all 5 lines update together.
- 📋 Live Dashboard Table: Displays each MA's label, trend direction (Up/Down), and percentage distance from price, refreshed on the latest bar.
- 🎨 Dynamic Trend Coloring: Lines, fills, and table text automatically switch between your chosen "Up" and "Down" colors based on whether price is above or below each MA.
- 🌈 Price-to-MA Fill Zones: Shaded regions between price and each MA make the gap easy to see at a glance.
- ⚙️ Fully Customizable: Adjust MA lengths, source, dashboard position, text size, and theme colors to fit your setup.
🧮 Calculation Logic:
The core getMa function selects the moving average algorithm based on the user's choice, while each MA's color and table row are derived from a simple comparison between price and that MA.
Pine Script®
💡 Interpretation:
- 🟢 Up (price > MA): Price is trading above the average — shown in your "Up Trend" color with a positive % distance.
- 🔴 Down (price < MA): Price is trading below the average — shown in your "Down Trend" color with a negative % distance.
- 📏 % Change: The percentage gap between price and each MA, useful for gauging how stretched or compressed price is relative to that average.
⚠️ Disclaimer:
This tool is provided for educational and informational purposes only. It does not constitute financial advice and does not guarantee future performance. Always combine it with your own analysis and proper risk management.
The Multiple MA Dashboard plots up to 5 moving averages of a chosen type (EMA, SMA, WMA, or RMA) directly on your chart and summarizes their relationship to price in a clean, real-time table. Instead of eyeballing where price sits relative to each average, this indicator gives you an instant Up/Down read and the exact percentage distance for every MA.
✨ Features:
- 📈 5 Configurable Moving Averages: Set independent lengths (defaults: 10, 20, 50, 100, 200) sharing one MA type and source.
- 🔁 Switchable MA Type: Choose between EMA, SMA, WMA, and RMA from a single dropdown — all 5 lines update together.
- 📋 Live Dashboard Table: Displays each MA's label, trend direction (Up/Down), and percentage distance from price, refreshed on the latest bar.
- 🎨 Dynamic Trend Coloring: Lines, fills, and table text automatically switch between your chosen "Up" and "Down" colors based on whether price is above or below each MA.
- 🌈 Price-to-MA Fill Zones: Shaded regions between price and each MA make the gap easy to see at a glance.
- ⚙️ Fully Customizable: Adjust MA lengths, source, dashboard position, text size, and theme colors to fit your setup.
🧮 Calculation Logic:
The core getMa function selects the moving average algorithm based on the user's choice, while each MA's color and table row are derived from a simple comparison between price and that MA.
💡 Interpretation:
- 🟢 Up (price > MA): Price is trading above the average — shown in your "Up Trend" color with a positive % distance.
- 🔴 Down (price < MA): Price is trading below the average — shown in your "Down Trend" color with a negative % distance.
- 📏 % Change: The percentage gap between price and each MA, useful for gauging how stretched or compressed price is relative to that average.
⚠️ Disclaimer:
This tool is provided for educational and informational purposes only. It does not constitute financial advice and does not guarantee future performance. Always combine it with your own analysis and proper risk management.
發行說明
Updated: Able to adjust color on MA發行說明
Fixed: Name開源腳本
秉持TradingView一貫精神,這個腳本的創作者將其設為開源,以便交易者檢視並驗證其功能。向作者致敬!您可以免費使用此腳本,但請注意,重新發佈代碼需遵守我們的社群規範。

免責聲明
這些資訊和出版物並非旨在提供,也不構成TradingView提供或認可的任何形式的財務、投資、交易或其他類型的建議或推薦。請閱讀使用條款以了解更多資訊。
免責聲明
這些資訊和出版物並非旨在提供,也不構成TradingView提供或認可的任何形式的財務、投資、交易或其他類型的建議或推薦。請閱讀使用條款以了解更多資訊。