OPEN-SOURCE SCRIPT
Alpha-Stable Stability Index [LB]
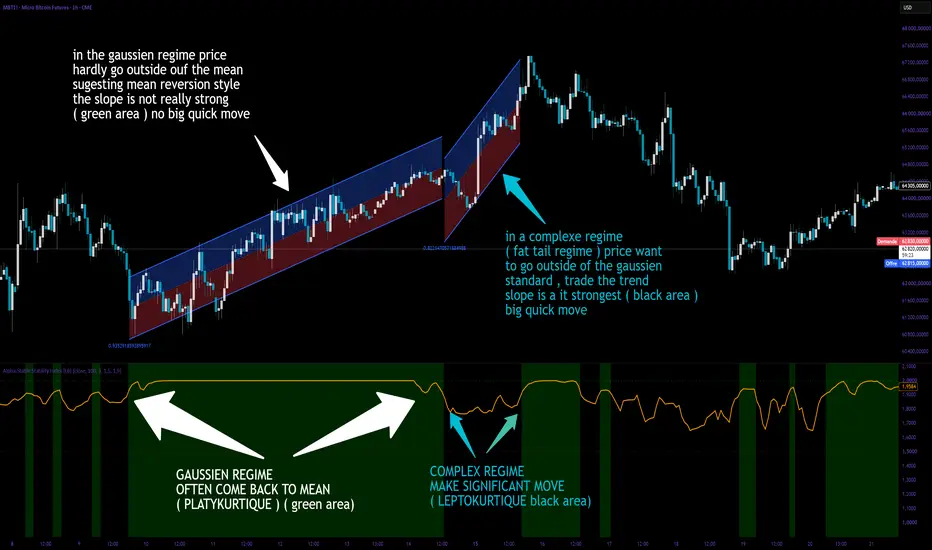
Concept
The Alpha-Stable Stability Index estimates the tail index alpha of an alpha-stable distribution using McCulloch's quantile method (1986). Alpha ranges from 0 (extremely heavy-tailed, infinite variance) to 2 (Gaussian, finite variance). The indicator quantifies how prone the market is to wild, outsized moves and visually separates the chart into three regimes : Gaussian (green), transitional (black/default background), and heavy-tailed (red).
Mathematical Foundation
The estimation follows McCulloch (1986), "Simple Consistent Estimators of Stable Distribution Parameters". It relies on sample quantiles, which are robust and computationally light.
Given a window of N log-returns sorted in ascending order, four quantiles are extracted :
q05 = 5th percentile
q25 = 25th percentile
q75 = 75th percentile
q95 = 95th percentile
The tail-to-body ratio nu is computed as :
nu = (q95 - q05) / (q75 - q25)
For a Gaussian distribution, nu is approximately 2.0. For heavy-tailed stable distributions, nu increases beyond 3.0. The indicator maps nu to alpha using a calibrated rational approximation of McCulloch's Table I :
alpha = 2.0 - 0.70 * ln(nu - 1.9) - 0.04 * (ln(nu - 1.9))^2
The result is clamped to [0.3, 2.0] and optionally smoothed with an EMA. The indicator pane displays three distinct visual zones :
- Green background : alpha >= Gaussian Threshold (default 1.9). The distribution is near-Gaussian (mesokurtic). Returns are well-behaved, standard risk management applies.
- Black/default background : alpha between the two thresholds. Transitional regime — neither fully stable nor clearly heavy-tailed.
- Red background : alpha <= Heavy Tail Threshold (default 1.5). The distribution is leptokurtic. Fat tails dominate, extreme events are structurally more frequent.
A brief glossary for interpretation :
Leptokurtic — positive excess kurtosis ; the distribution has fatter tails and a sharper peak than the Gaussian. Alpha < 2.0 indicates leptokurtosis. Price action alternates between long quiet periods and sudden violent bursts.
Platykurtic — negative excess kurtosis ; thinner tails and a flatter peak than the Gaussian. Rare in financial returns but can appear in heavily mean-reverting or range-bound markets. Alpha close to 2.0 with low overall volatility may suggest platykurtic behavior.
Mesokurtic — kurtosis equal to that of the Gaussian (excess kurtosis = 0). Alpha = 2.0 corresponds to this regime. The green background signals this state.
What Problem Does It Solve ?
Classic volatility measures (standard deviation, ATR, historical vol) assume finite second moments and treat all deviations as coming from the same distribution. When the true return distribution is alpha-stable with alpha < 2, the variance is infinite and standard deviation becomes meaningless. The alpha index directly measures tail heaviness without assuming normality, and the green/black/red background gives an immediate visual cue of the risk regime.

How To Interpret
Alpha in the green zone (>= 1.9) — mesokurtic / near-Gaussian. Returns are well-behaved, standard risk management applies.
Alpha in the black zone (1.5 to 1.9) — transitional. The market is neither fully stable nor fully wild ; monitor for a move into the red zone.
Alpha in the red zone (<= 1.5) — leptokurtic / heavy-tailed. The distribution has undefined or extremely high variance. Large price swings are likely. Consider reducing position size, widening stops, and hedging tail risk.
Alpha declining — the market is transitioning toward instability ; rising tail risk ahead.
Parameters
Source — price data for return calculation (default close).
Window Length — number of bars used to compute the empirical quantiles. Longer windows give more stable estimates but react more slowly.
Smoothing — EMA period applied to the raw alpha estimate to reduce noise.
Heavy Tail Threshold — background turns red when alpha falls below this level (default 1.5).
Gaussian Threshold — background turns green when alpha exceeds this level (default 1.9).
Reference
McCulloch J.H., "Simple Consistent Estimators of Stable Distribution Parameters", Communications in Statistics — Simulation and Computation, Vol. 15, No. 4, pp. 1109-1136, 1986.
The Alpha-Stable Stability Index estimates the tail index alpha of an alpha-stable distribution using McCulloch's quantile method (1986). Alpha ranges from 0 (extremely heavy-tailed, infinite variance) to 2 (Gaussian, finite variance). The indicator quantifies how prone the market is to wild, outsized moves and visually separates the chart into three regimes : Gaussian (green), transitional (black/default background), and heavy-tailed (red).
Mathematical Foundation
The estimation follows McCulloch (1986), "Simple Consistent Estimators of Stable Distribution Parameters". It relies on sample quantiles, which are robust and computationally light.
Given a window of N log-returns sorted in ascending order, four quantiles are extracted :
q05 = 5th percentile
q25 = 25th percentile
q75 = 75th percentile
q95 = 95th percentile
The tail-to-body ratio nu is computed as :
nu = (q95 - q05) / (q75 - q25)
For a Gaussian distribution, nu is approximately 2.0. For heavy-tailed stable distributions, nu increases beyond 3.0. The indicator maps nu to alpha using a calibrated rational approximation of McCulloch's Table I :
alpha = 2.0 - 0.70 * ln(nu - 1.9) - 0.04 * (ln(nu - 1.9))^2
The result is clamped to [0.3, 2.0] and optionally smoothed with an EMA. The indicator pane displays three distinct visual zones :
- Green background : alpha >= Gaussian Threshold (default 1.9). The distribution is near-Gaussian (mesokurtic). Returns are well-behaved, standard risk management applies.
- Black/default background : alpha between the two thresholds. Transitional regime — neither fully stable nor clearly heavy-tailed.
- Red background : alpha <= Heavy Tail Threshold (default 1.5). The distribution is leptokurtic. Fat tails dominate, extreme events are structurally more frequent.
A brief glossary for interpretation :
Leptokurtic — positive excess kurtosis ; the distribution has fatter tails and a sharper peak than the Gaussian. Alpha < 2.0 indicates leptokurtosis. Price action alternates between long quiet periods and sudden violent bursts.
Platykurtic — negative excess kurtosis ; thinner tails and a flatter peak than the Gaussian. Rare in financial returns but can appear in heavily mean-reverting or range-bound markets. Alpha close to 2.0 with low overall volatility may suggest platykurtic behavior.
Mesokurtic — kurtosis equal to that of the Gaussian (excess kurtosis = 0). Alpha = 2.0 corresponds to this regime. The green background signals this state.
What Problem Does It Solve ?
Classic volatility measures (standard deviation, ATR, historical vol) assume finite second moments and treat all deviations as coming from the same distribution. When the true return distribution is alpha-stable with alpha < 2, the variance is infinite and standard deviation becomes meaningless. The alpha index directly measures tail heaviness without assuming normality, and the green/black/red background gives an immediate visual cue of the risk regime.
How To Interpret
Alpha in the green zone (>= 1.9) — mesokurtic / near-Gaussian. Returns are well-behaved, standard risk management applies.
Alpha in the black zone (1.5 to 1.9) — transitional. The market is neither fully stable nor fully wild ; monitor for a move into the red zone.
Alpha in the red zone (<= 1.5) — leptokurtic / heavy-tailed. The distribution has undefined or extremely high variance. Large price swings are likely. Consider reducing position size, widening stops, and hedging tail risk.
Alpha declining — the market is transitioning toward instability ; rising tail risk ahead.
Parameters
Source — price data for return calculation (default close).
Window Length — number of bars used to compute the empirical quantiles. Longer windows give more stable estimates but react more slowly.
Smoothing — EMA period applied to the raw alpha estimate to reduce noise.
Heavy Tail Threshold — background turns red when alpha falls below this level (default 1.5).
Gaussian Threshold — background turns green when alpha exceeds this level (default 1.9).
Reference
McCulloch J.H., "Simple Consistent Estimators of Stable Distribution Parameters", Communications in Statistics — Simulation and Computation, Vol. 15, No. 4, pp. 1109-1136, 1986.
開源腳本
秉持TradingView一貫精神,這個腳本的創作者將其設為開源,以便交易者檢視並驗證其功能。向作者致敬!您可以免費使用此腳本,但請注意,重新發佈代碼需遵守我們的社群規範。

免責聲明
這些資訊和出版物並非旨在提供,也不構成TradingView提供或認可的任何形式的財務、投資、交易或其他類型的建議或推薦。請閱讀使用條款以了解更多資訊。
開源腳本
秉持TradingView一貫精神,這個腳本的創作者將其設為開源,以便交易者檢視並驗證其功能。向作者致敬!您可以免費使用此腳本,但請注意,重新發佈代碼需遵守我們的社群規範。
免責聲明
這些資訊和出版物並非旨在提供,也不構成TradingView提供或認可的任何形式的財務、投資、交易或其他類型的建議或推薦。請閱讀使用條款以了解更多資訊。