OPEN-SOURCE SCRIPT
Fear & Greed Index
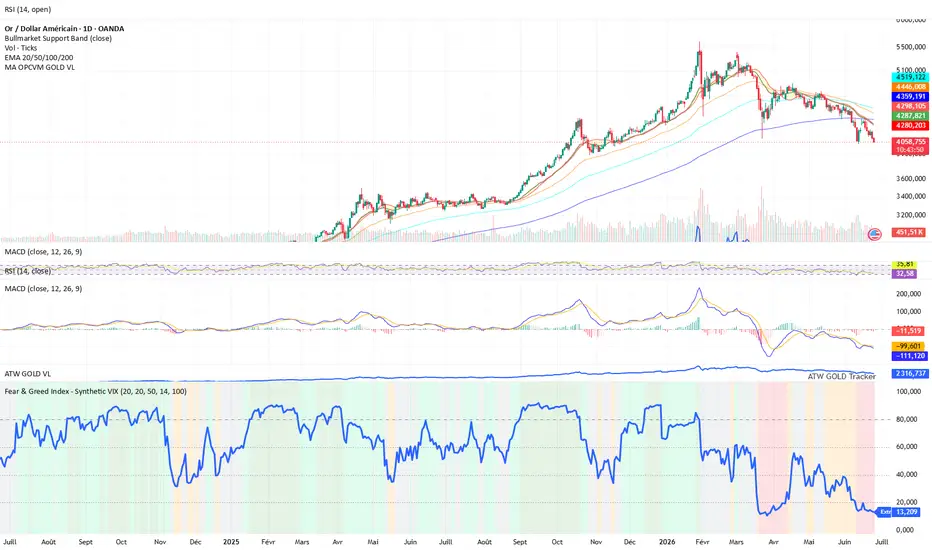
The Fear & Greed Index is a synthetic market sentiment indicator designed to convert multiple technical signals into a single 0–100 score.
Its purpose is to quickly identify market phases of fear, neutrality, or greed across any asset or index.
This indicator does not rely on an official VIX.
Instead, it uses synthetic realized volatility, combined with trend and momentum metrics, to provide a visual reading of market sentiment and regime conditions.
Methodology
The score is built from several components:
Realized volatility
used as a market stress proxy: higher volatility pushes the index toward fear.
Momentum
captures recent price acceleration or deterioration.
RSI
evaluates market strength and overbought / oversold conditions.
Trend vs moving average
compares current price to its moving average to assess directional bias.
Drawdown
measures the distance from recent highs to identify stress, correction, or recovery phases.
Score interpretation
The final score is normalized between 0 and 100:
0 – 20 → Extreme Fear
20 – 40 → Fear
40 – 60 → Neutral
60 – 80 → Greed
80 – 100 → Extreme Greed
How to use it
Low readings usually reflect stressed, volatile, or corrective market conditions.
High readings usually reflect confident, bullish, or potentially overheated market conditions.
The indicator is best used as a market regime / sentiment filter, not as a standalone buy or sell signal.
Disclaimer
This script is a synthetic sentiment indicator based on price and volume data.
It is not an official volatility index and should not be considered investment advice.
Its purpose is to quickly identify market phases of fear, neutrality, or greed across any asset or index.
This indicator does not rely on an official VIX.
Instead, it uses synthetic realized volatility, combined with trend and momentum metrics, to provide a visual reading of market sentiment and regime conditions.
Methodology
The score is built from several components:
Realized volatility
used as a market stress proxy: higher volatility pushes the index toward fear.
Momentum
captures recent price acceleration or deterioration.
RSI
evaluates market strength and overbought / oversold conditions.
Trend vs moving average
compares current price to its moving average to assess directional bias.
Drawdown
measures the distance from recent highs to identify stress, correction, or recovery phases.
Score interpretation
The final score is normalized between 0 and 100:
0 – 20 → Extreme Fear
20 – 40 → Fear
40 – 60 → Neutral
60 – 80 → Greed
80 – 100 → Extreme Greed
How to use it
Low readings usually reflect stressed, volatile, or corrective market conditions.
High readings usually reflect confident, bullish, or potentially overheated market conditions.
The indicator is best used as a market regime / sentiment filter, not as a standalone buy or sell signal.
Disclaimer
This script is a synthetic sentiment indicator based on price and volume data.
It is not an official volatility index and should not be considered investment advice.
開源腳本
秉持TradingView一貫精神,這個腳本的創作者將其設為開源,以便交易者檢視並驗證其功能。向作者致敬!您可以免費使用此腳本,但請注意,重新發佈代碼需遵守我們的社群規範。

免責聲明
這些資訊和出版物並非旨在提供,也不構成TradingView提供或認可的任何形式的財務、投資、交易或其他類型的建議或推薦。請閱讀使用條款以了解更多資訊。
開源腳本
秉持TradingView一貫精神,這個腳本的創作者將其設為開源,以便交易者檢視並驗證其功能。向作者致敬!您可以免費使用此腳本,但請注意,重新發佈代碼需遵守我們的社群規範。
免責聲明
這些資訊和出版物並非旨在提供,也不構成TradingView提供或認可的任何形式的財務、投資、交易或其他類型的建議或推薦。請閱讀使用條款以了解更多資訊。