Breakout Signals by Marat
WHAT IT DOES
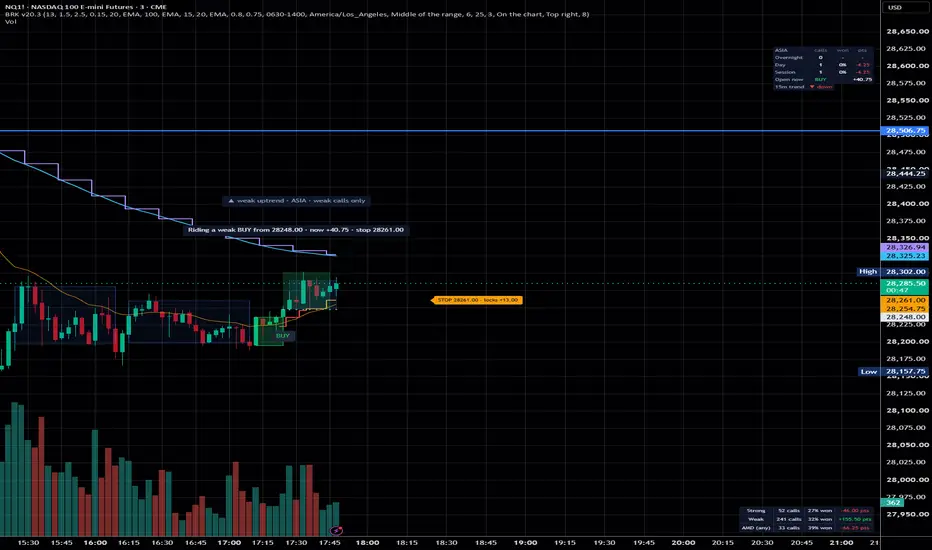
Breakout Signals finds tight clusters of candles, boxes them as they form, and calls the break when a candle closes outside the box. Each call is graded by trend and session, then followed with a trailing stop until it ends. Everything is drawn on the chart: the range, the call, the stop, and the points made or lost.
It was built and tuned on the NQ 1-minute chart. It draws and alerts only. It does not place orders.
HOW IT WORKS
1. Ranges. A tight range is 13 or more candles whose bodies fit inside 1.5 x the 50-period ATR. The box starts drawing as soon as candles bunch up and grows with the range. A second, looser kind of cluster (tall for the ATR, but only about 2.5 of its own candles tall) is boxed in a fainter color to show its levels. Loose clusters give no call by default.
2. Calls. A call fires when a candle closes outside a tight range in the direction of the fast trend line.
- STRONG (bright bubble): the fast and slow trend lines both agree, it is inside the New York day session, the market has been active before the break, and the close is not stretched far past the edge.
- weak (dark bubble): the fast trend agrees but one of the other conditions does not.
- A break against the fast trend gives no call and leaves a grey box.
3. Sweeps and AMD. If a wick pokes out one side of the range and closes back inside, that candle is marked SWEEP. A call that then breaks the other side is tagged AMD (accumulation, manipulation, distribution). It is a tag, not a grade.
4. Following the move. One call is followed at a time. The first stop sits at the middle of the range, between 6 and 20 points away. After that it steps along behind the last 3 finished candles and only moves in the call's favor. The stop is checked on every tick, so a hit shows the moment price touches it. The call ends on the stop, at the end of the session, or when a call the other way arrives. The exit is marked with a cross at the fill price and a bubble showing the points.
5. Live candle. While a candle is still forming, the script shows "getting close" when price presses an edge, and "LIVE" with a countdown when price is outside the range. The range box pulses in the call's color while this is happening. A LIVE call is not final until the candle closes.
WHAT IS ON THE CHART
- Blue box: range forming or ready. Green or red box: the range gave a call. Grey box: no call.
- Shaded zone and step line: the move being followed and its trailing stop.
- Status bubbles above the latest candles: current trend, which session is open (ASIA, LONDON or NEW YORK), and what the script is waiting for.
- Fast and slow trend lines, plus a higher-timeframe line (15-minute EMA 20 by default) taken from the last finished candle so it does not repaint.
- Session markers for the 15:00 open and the 06:30 day session, and a small dashboard with calls, win rate and points for the current session, split into overnight and day.
SETTINGS
- Range: candles needed, tightness, loose clusters on or off, sweep size.
- Trend and sessions: length and type of each trend line (EMA, SMA, WMA, RMA, HMA, VWMA), the higher-timeframe line, day session hours and time zone, the two fakeout guards, weak calls on or off.
- Stop: where the first stop sits, its closest and farthest distance, and how many candles the trail follows.
- Display: status line, key, session markers, dashboard position and how far it sits from the top, results table, colors, logging of every call to Pine Logs, and a speed setting that only draws the most recent candles.
- Phone layout: one status line and a one-line dashboard, with the key and extra tables hidden, for small screens.
ALERTS
Strong BUY, Strong SELL, Weak call, AMD call, Range ready, Call ended, and an early LIVE alert that fires before the candle closes. Set the LIVE alert to "Once Per Bar". The others work on bar close.
NOTES AND LIMITS
- Confirmed calls do not repaint. They are fixed when the candle closes. The LIVE and "getting close" warnings can disappear if the candle closes back inside the range.
- Defaults were tuned on NQ 1-minute. Other symbols and timeframes need their own settings. In the author's testing the same defaults did not hold up on the 2-minute chart.
- Weak calls are shown by default. In the author's testing they were not profitable as a group. They can be switched off in settings.
- Points shown on the chart are the script's own bookkeeping from candle data. They ignore slippage and commissions and are not trade results.
- This is a charting tool, not financial advice. Past behavior on historical data does not predict future results.
Breakout Signals finds tight clusters of candles, boxes them as they form, and calls the break when a candle closes outside the box. Each call is graded by trend and session, then followed with a trailing stop until it ends. Everything is drawn on the chart: the range, the call, the stop, and the points made or lost.
It was built and tuned on the NQ 1-minute chart. It draws and alerts only. It does not place orders.
HOW IT WORKS
1. Ranges. A tight range is 13 or more candles whose bodies fit inside 1.5 x the 50-period ATR. The box starts drawing as soon as candles bunch up and grows with the range. A second, looser kind of cluster (tall for the ATR, but only about 2.5 of its own candles tall) is boxed in a fainter color to show its levels. Loose clusters give no call by default.
2. Calls. A call fires when a candle closes outside a tight range in the direction of the fast trend line.
- STRONG (bright bubble): the fast and slow trend lines both agree, it is inside the New York day session, the market has been active before the break, and the close is not stretched far past the edge.
- weak (dark bubble): the fast trend agrees but one of the other conditions does not.
- A break against the fast trend gives no call and leaves a grey box.
3. Sweeps and AMD. If a wick pokes out one side of the range and closes back inside, that candle is marked SWEEP. A call that then breaks the other side is tagged AMD (accumulation, manipulation, distribution). It is a tag, not a grade.
4. Following the move. One call is followed at a time. The first stop sits at the middle of the range, between 6 and 20 points away. After that it steps along behind the last 3 finished candles and only moves in the call's favor. The stop is checked on every tick, so a hit shows the moment price touches it. The call ends on the stop, at the end of the session, or when a call the other way arrives. The exit is marked with a cross at the fill price and a bubble showing the points.
5. Live candle. While a candle is still forming, the script shows "getting close" when price presses an edge, and "LIVE" with a countdown when price is outside the range. The range box pulses in the call's color while this is happening. A LIVE call is not final until the candle closes.
WHAT IS ON THE CHART
- Blue box: range forming or ready. Green or red box: the range gave a call. Grey box: no call.
- Shaded zone and step line: the move being followed and its trailing stop.
- Status bubbles above the latest candles: current trend, which session is open (ASIA, LONDON or NEW YORK), and what the script is waiting for.
- Fast and slow trend lines, plus a higher-timeframe line (15-minute EMA 20 by default) taken from the last finished candle so it does not repaint.
- Session markers for the 15:00 open and the 06:30 day session, and a small dashboard with calls, win rate and points for the current session, split into overnight and day.
SETTINGS
- Range: candles needed, tightness, loose clusters on or off, sweep size.
- Trend and sessions: length and type of each trend line (EMA, SMA, WMA, RMA, HMA, VWMA), the higher-timeframe line, day session hours and time zone, the two fakeout guards, weak calls on or off.
- Stop: where the first stop sits, its closest and farthest distance, and how many candles the trail follows.
- Display: status line, key, session markers, dashboard position and how far it sits from the top, results table, colors, logging of every call to Pine Logs, and a speed setting that only draws the most recent candles.
- Phone layout: one status line and a one-line dashboard, with the key and extra tables hidden, for small screens.
ALERTS
Strong BUY, Strong SELL, Weak call, AMD call, Range ready, Call ended, and an early LIVE alert that fires before the candle closes. Set the LIVE alert to "Once Per Bar". The others work on bar close.
NOTES AND LIMITS
- Confirmed calls do not repaint. They are fixed when the candle closes. The LIVE and "getting close" warnings can disappear if the candle closes back inside the range.
- Defaults were tuned on NQ 1-minute. Other symbols and timeframes need their own settings. In the author's testing the same defaults did not hold up on the 2-minute chart.
- Weak calls are shown by default. In the author's testing they were not profitable as a group. They can be switched off in settings.
- Points shown on the chart are the script's own bookkeeping from candle data. They ignore slippage and commissions and are not trade results.
- This is a charting tool, not financial advice. Past behavior on historical data does not predict future results.

免責聲明
這些資訊和出版物並非旨在提供,也不構成TradingView提供或認可的任何形式的財務、投資、交易或其他類型的建議或推薦。請閱讀使用條款以了解更多資訊。
免責聲明
這些資訊和出版物並非旨在提供,也不構成TradingView提供或認可的任何形式的財務、投資、交易或其他類型的建議或推薦。請閱讀使用條款以了解更多資訊。