Bollinger Bands Width % Normalizer
## Overview
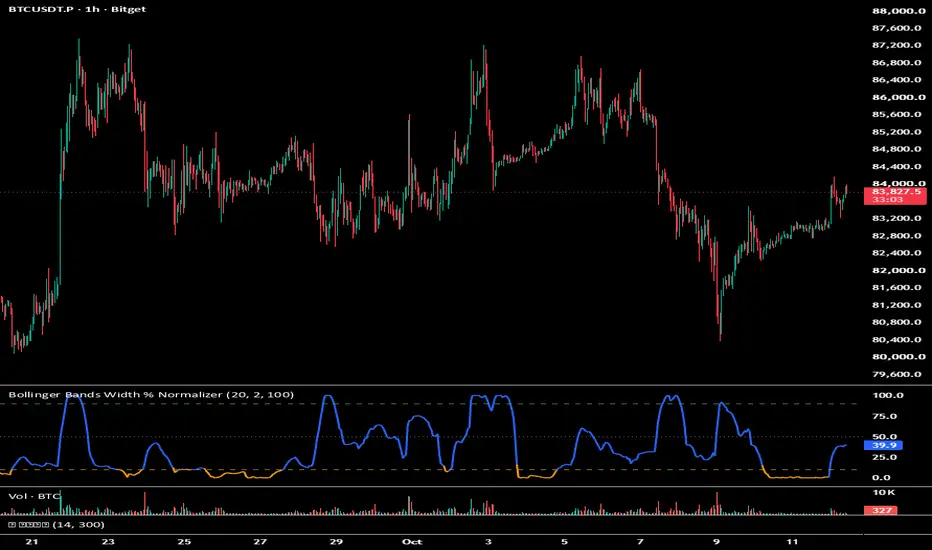
The **Bollinger Bands Width % Normalizer** is an advanced volatility oscillator designed to isolate tight market squeezes and major breakout points.
While the standard Bollinger Bands Width (BBW) is highly effective at displaying compression, its absolute values shift drastically depending on the asset's price scale and regime. This indicator solves that flaw by **normalizing the bandwidth into a strict, universal 0–100 scale** using a rolling historical lookback window. Now, you can instantly identify low-volatility dead zones and explosive trend initiations on any asset (Crypto, Forex, Stocks) with a single, unified rule.
---
## How It Works
1. **Bandwidth Calculation (BBW):** The indicator first calculates standard Bollinger Bands and determines the current bandwidth ($
BBW
= \frac{Upper Band - Lower Band}{Basis}$$).
2. **0–100 Rescaling (Normalization):** It scans the historical data over a user-defined period (`Normalization Lookback Period`) to locate the absolute maximum and minimum bandwidths. The current BBW is then plotted relative to that history on a **0 to 100** scale.
---
## Key Features & Settings
* **BB Length (Default: 20):** Adjusts the baseline moving average period for the Bollinger Bands.
* **BB Standard Deviation (Default: 2.0):** Standard deviation multiplier defining the outer bands.
* **Normalization Lookback Period (Default: 100):** The historical window used to benchmark the highest and lowest compression states.
* **Squeeze Alert Coloring:** The line dynamically turns **Orange** when the normalized score drops below 10, signaling a prime contraction phase.
---
## How to Trade with This Indicator
### 1. Filtering Out the Noise (The Squeeze Zone)
* When the score drops **below 10**, the plot turns **Orange**.
* This tells you that the bands are currently tighter than 90% of the recent price action.
* **Action:** Avoid trading trend-continuation or mean-reversion strategies inside this zone, as price movement will be suffocated and flat.
### 2. Anticiapting the Coiled Spring (Breakout Preparation)
* Extreme market compressions always precede massive, explosive trend expansions.
* If the indicator sits entrenched in the orange zone (below 10) for an extended duration, a severe volatility breakout is brewing.
* **Action:** Set alert zones at local highs/lows. Prepare your breakout triggers for when the score hooks sharply out of the extreme low zone.
### 3. Exhaustion & Climax Detection
* A surge **above 90** flags that the current trend expansion is reaching extreme historical widths relative to the lookback window.
* **Action:** Exercise caution if you are holding a mature trend position, as a widening of this magnitude often points to an exhaustive climax or impending mean reversion.
The **Bollinger Bands Width % Normalizer** is an advanced volatility oscillator designed to isolate tight market squeezes and major breakout points.
While the standard Bollinger Bands Width (BBW) is highly effective at displaying compression, its absolute values shift drastically depending on the asset's price scale and regime. This indicator solves that flaw by **normalizing the bandwidth into a strict, universal 0–100 scale** using a rolling historical lookback window. Now, you can instantly identify low-volatility dead zones and explosive trend initiations on any asset (Crypto, Forex, Stocks) with a single, unified rule.
---
## How It Works
1. **Bandwidth Calculation (BBW):** The indicator first calculates standard Bollinger Bands and determines the current bandwidth ($
BBW
= \frac{Upper Band - Lower Band}{Basis}$$).
2. **0–100 Rescaling (Normalization):** It scans the historical data over a user-defined period (`Normalization Lookback Period`) to locate the absolute maximum and minimum bandwidths. The current BBW is then plotted relative to that history on a **0 to 100** scale.
---
## Key Features & Settings
* **BB Length (Default: 20):** Adjusts the baseline moving average period for the Bollinger Bands.
* **BB Standard Deviation (Default: 2.0):** Standard deviation multiplier defining the outer bands.
* **Normalization Lookback Period (Default: 100):** The historical window used to benchmark the highest and lowest compression states.
* **Squeeze Alert Coloring:** The line dynamically turns **Orange** when the normalized score drops below 10, signaling a prime contraction phase.
---
## How to Trade with This Indicator
### 1. Filtering Out the Noise (The Squeeze Zone)
* When the score drops **below 10**, the plot turns **Orange**.
* This tells you that the bands are currently tighter than 90% of the recent price action.
* **Action:** Avoid trading trend-continuation or mean-reversion strategies inside this zone, as price movement will be suffocated and flat.
### 2. Anticiapting the Coiled Spring (Breakout Preparation)
* Extreme market compressions always precede massive, explosive trend expansions.
* If the indicator sits entrenched in the orange zone (below 10) for an extended duration, a severe volatility breakout is brewing.
* **Action:** Set alert zones at local highs/lows. Prepare your breakout triggers for when the score hooks sharply out of the extreme low zone.
### 3. Exhaustion & Climax Detection
* A surge **above 90** flags that the current trend expansion is reaching extreme historical widths relative to the lookback window.
* **Action:** Exercise caution if you are holding a mature trend position, as a widening of this magnitude often points to an exhaustive climax or impending mean reversion.

MoneyFollow | Symmetric Wave Trading
Explore MoneyFollow Apex Symmetry and follow updates on its official script page.
Discover the theory behind the strategy in my book, “Symmetry Theory:The New Standard of Wave Analysis.” Book link on my profile.
Explore MoneyFollow Apex Symmetry and follow updates on its official script page.
Discover the theory behind the strategy in my book, “Symmetry Theory:The New Standard of Wave Analysis.” Book link on my profile.
免責聲明
這些資訊和出版物並非旨在提供,也不構成TradingView提供或認可的任何形式的財務、投資、交易或其他類型的建議或推薦。請閱讀使用條款以了解更多資訊。
MoneyFollow | Symmetric Wave Trading
Explore MoneyFollow Apex Symmetry and follow updates on its official script page.
Discover the theory behind the strategy in my book, “Symmetry Theory:The New Standard of Wave Analysis.” Book link on my profile.
Explore MoneyFollow Apex Symmetry and follow updates on its official script page.
Discover the theory behind the strategy in my book, “Symmetry Theory:The New Standard of Wave Analysis.” Book link on my profile.
免責聲明
這些資訊和出版物並非旨在提供,也不構成TradingView提供或認可的任何形式的財務、投資、交易或其他類型的建議或推薦。請閱讀使用條款以了解更多資訊。