OPEN-SOURCE SCRIPT
FTNS Multi-Asset Correlation HUD
Introduction
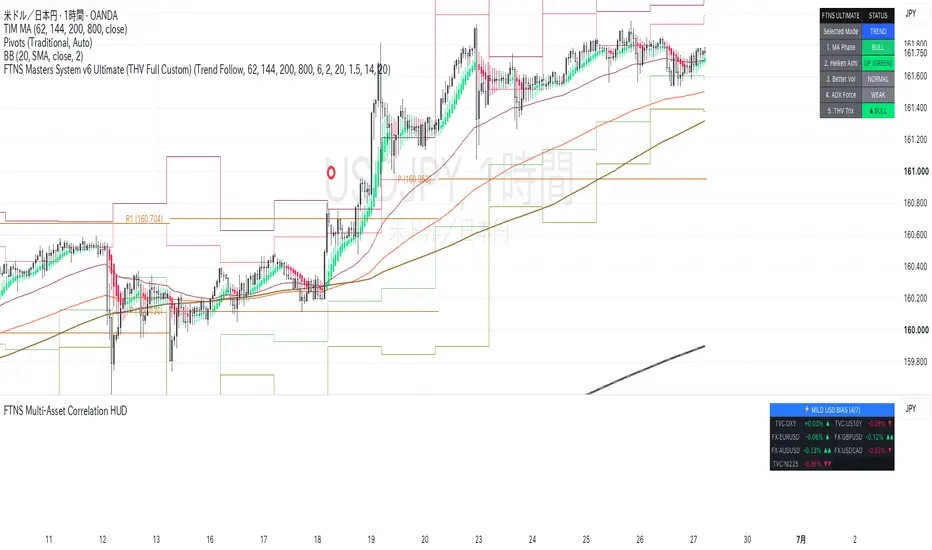
The FTNS Multi-Asset Correlation HUD is a highly sophisticated, real-time intermarket environment analyzer engineered for Pine Script v6. Inspired by the legendary "Bottomscan" tool from the classic daytradenet.com, this indicator allows traders to monitor up to 15 interrelated assets simultaneously and instantly gauge their collective macro impact on a target currency pair or financial instrument (ideally optimized for USD/JPY).
Unlike standard correlation tables that merely display raw price percentage changes, this HUD features a proprietary "Judgement Engine" that translates individual asset dynamics into directional pressures affecting your primary trading vehicle.
The Core Innovation: The "Judgement" System
The heart of this indicator is the Judgement column. It does not simply show whether a correlated asset is moving up or down; it explicitly calculates how that specific movement influences your target instrument based on its predefined directional bias (Positive or Negative correlation).
* ▲▲ / ▲ (Bullish Pressure): Intermarket forces are acting to push the target instrument higher (e.g., Rising US10Y Yields or a surging Dollar Index for USD/JPY). Color-coded in bright green.
* ▼▼ / ▼ (Bearish Pressure): Intermarket forces are acting to drag the target instrument lower (e.g., A dropping Nikkei 225 triggering a risk-off Yen-buying anomaly). Color-coded in bright red.
* ■ (Neutral): Flatlined or no significant momentum change.
💡 Real-World Example (USD/JPY Setup):
* If US 10-Year Yields (US10Y) fall, it exerts downward pressure on USD/JPY. The HUD instantly logs this asset and displays a red ▼ or ▼▼.
* If the Nikkei 225 (NI225) drops, historical correlation dictates a stronger Yen (risk-off Yen repatriation), resulting in downward pressure on USD/JPY. The HUD automatically interprets this market drop as a bearish factor for USD/JPY, flashing a red warning sign.
Key Features
1. 15-Asset Intermarket Matrix
Fully customizable tracking for up to 15 financial assets across different sectors (FX Pairs, Equities, Bond Yields, Commodities, or Crypto). Easily toggle visibility and set independent Positive (+) or Negative (-) correlation rules.
2. Bottomscan-Style Vector Symbols
Employs highly legible classical vector symbols (`▲▲`, `▲`, `▼▼`, `▼`, `■`) to represent both the direction and velocity of intermarket cross-currents at a single glance.
3. **Adjustable "Strong Bias" Threshold**
Tailor the exact Rate of Change (ROC%) required to trigger a strong trend warning. When an asset's ROC exceeds your custom threshold, the HUD automatically upgrades the vector to a dual symbol (`▲▲` or `▼▼`).
4. High-Congruence Macro Alert (Flash Gimmick)
When a critical mass of monitored assets aligns seamlessly in the same directional bias (66.6% or 75%+ congruence), the top status bar dynamically shifts its state and flashes vivid colors to warn you of institutional macro-driven breakouts or high-probability trend continuations.
5. Modern Flat Design UI Layout
Built with a borderless, shadowless flat design aesthetic. It sits perfectly into any dark or light trading setup without cluttering your screen or causing visual fatigue.
6. Status Line Parameter Hiding
Leverages advanced Pine Script v6 properties (`display=display.none`) to completely hide all 45+ internal input variables from the top-left chart status line. Your workspace stays clean and pristine, showing only the script name while leaving settings fully customizable in the inputs menu.
How to Use
1. Apply the indicator to your primary trading asset (e.g., USD/JPY).
2. Open the settings panel and load the symbols that fundamentally drive your target market (e.g., DXY, US10Y, EURUSD, NI225, XAUUSD).
3. Assign the mathematically correct correlation rule (`Positive` or `Negative`) for each secondary asset.
4. Adjust the KPI Timeframe (ROC) and Strong Bias Threshold (%) to match your trading style (Scalping, Day Trading, or Swing Trading).
5. Monitor the Master Status Bar for institutional flow alignment and use the Judgement matrix to avoid trading against the broader macroeconomic tide.
The FTNS Multi-Asset Correlation HUD is a highly sophisticated, real-time intermarket environment analyzer engineered for Pine Script v6. Inspired by the legendary "Bottomscan" tool from the classic daytradenet.com, this indicator allows traders to monitor up to 15 interrelated assets simultaneously and instantly gauge their collective macro impact on a target currency pair or financial instrument (ideally optimized for USD/JPY).
Unlike standard correlation tables that merely display raw price percentage changes, this HUD features a proprietary "Judgement Engine" that translates individual asset dynamics into directional pressures affecting your primary trading vehicle.
The Core Innovation: The "Judgement" System
The heart of this indicator is the Judgement column. It does not simply show whether a correlated asset is moving up or down; it explicitly calculates how that specific movement influences your target instrument based on its predefined directional bias (Positive or Negative correlation).
* ▲▲ / ▲ (Bullish Pressure): Intermarket forces are acting to push the target instrument higher (e.g., Rising US10Y Yields or a surging Dollar Index for USD/JPY). Color-coded in bright green.
* ▼▼ / ▼ (Bearish Pressure): Intermarket forces are acting to drag the target instrument lower (e.g., A dropping Nikkei 225 triggering a risk-off Yen-buying anomaly). Color-coded in bright red.
* ■ (Neutral): Flatlined or no significant momentum change.
💡 Real-World Example (USD/JPY Setup):
* If US 10-Year Yields (US10Y) fall, it exerts downward pressure on USD/JPY. The HUD instantly logs this asset and displays a red ▼ or ▼▼.
* If the Nikkei 225 (NI225) drops, historical correlation dictates a stronger Yen (risk-off Yen repatriation), resulting in downward pressure on USD/JPY. The HUD automatically interprets this market drop as a bearish factor for USD/JPY, flashing a red warning sign.
Key Features
1. 15-Asset Intermarket Matrix
Fully customizable tracking for up to 15 financial assets across different sectors (FX Pairs, Equities, Bond Yields, Commodities, or Crypto). Easily toggle visibility and set independent Positive (+) or Negative (-) correlation rules.
2. Bottomscan-Style Vector Symbols
Employs highly legible classical vector symbols (`▲▲`, `▲`, `▼▼`, `▼`, `■`) to represent both the direction and velocity of intermarket cross-currents at a single glance.
3. **Adjustable "Strong Bias" Threshold**
Tailor the exact Rate of Change (ROC%) required to trigger a strong trend warning. When an asset's ROC exceeds your custom threshold, the HUD automatically upgrades the vector to a dual symbol (`▲▲` or `▼▼`).
4. High-Congruence Macro Alert (Flash Gimmick)
When a critical mass of monitored assets aligns seamlessly in the same directional bias (66.6% or 75%+ congruence), the top status bar dynamically shifts its state and flashes vivid colors to warn you of institutional macro-driven breakouts or high-probability trend continuations.
5. Modern Flat Design UI Layout
Built with a borderless, shadowless flat design aesthetic. It sits perfectly into any dark or light trading setup without cluttering your screen or causing visual fatigue.
6. Status Line Parameter Hiding
Leverages advanced Pine Script v6 properties (`display=display.none`) to completely hide all 45+ internal input variables from the top-left chart status line. Your workspace stays clean and pristine, showing only the script name while leaving settings fully customizable in the inputs menu.
How to Use
1. Apply the indicator to your primary trading asset (e.g., USD/JPY).
2. Open the settings panel and load the symbols that fundamentally drive your target market (e.g., DXY, US10Y, EURUSD, NI225, XAUUSD).
3. Assign the mathematically correct correlation rule (`Positive` or `Negative`) for each secondary asset.
4. Adjust the KPI Timeframe (ROC) and Strong Bias Threshold (%) to match your trading style (Scalping, Day Trading, or Swing Trading).
5. Monitor the Master Status Bar for institutional flow alignment and use the Judgement matrix to avoid trading against the broader macroeconomic tide.
開源腳本
秉持TradingView一貫精神,這個腳本的創作者將其設為開源,以便交易者檢視並驗證其功能。向作者致敬!您可以免費使用此腳本,但請注意,重新發佈代碼需遵守我們的社群規範。

AIトレード専門家・猫飼い(FX_Shokunin)|FXノウハウサイト「Tribe FX」運営。
AIを活用した実践的なトレード手法と検証データを専門的に発信しています。テクノロジーで成果を最大化する投資戦略を学びたい方は、ぜひ公式ブログをご覧ください。
AIを活用した実践的なトレード手法と検証データを専門的に発信しています。テクノロジーで成果を最大化する投資戦略を学びたい方は、ぜひ公式ブログをご覧ください。
免責聲明
這些資訊和出版物並非旨在提供,也不構成TradingView提供或認可的任何形式的財務、投資、交易或其他類型的建議或推薦。請閱讀使用條款以了解更多資訊。
開源腳本
秉持TradingView一貫精神,這個腳本的創作者將其設為開源,以便交易者檢視並驗證其功能。向作者致敬!您可以免費使用此腳本,但請注意,重新發佈代碼需遵守我們的社群規範。
AIトレード専門家・猫飼い(FX_Shokunin)|FXノウハウサイト「Tribe FX」運営。
AIを活用した実践的なトレード手法と検証データを専門的に発信しています。テクノロジーで成果を最大化する投資戦略を学びたい方は、ぜひ公式ブログをご覧ください。
AIを活用した実践的なトレード手法と検証データを専門的に発信しています。テクノロジーで成果を最大化する投資戦略を学びたい方は、ぜひ公式ブログをご覧ください。
免責聲明
這些資訊和出版物並非旨在提供,也不構成TradingView提供或認可的任何形式的財務、投資、交易或其他類型的建議或推薦。請閱讀使用條款以了解更多資訊。