PROTECTED SOURCE SCRIPT
MACD Histogram Divergence
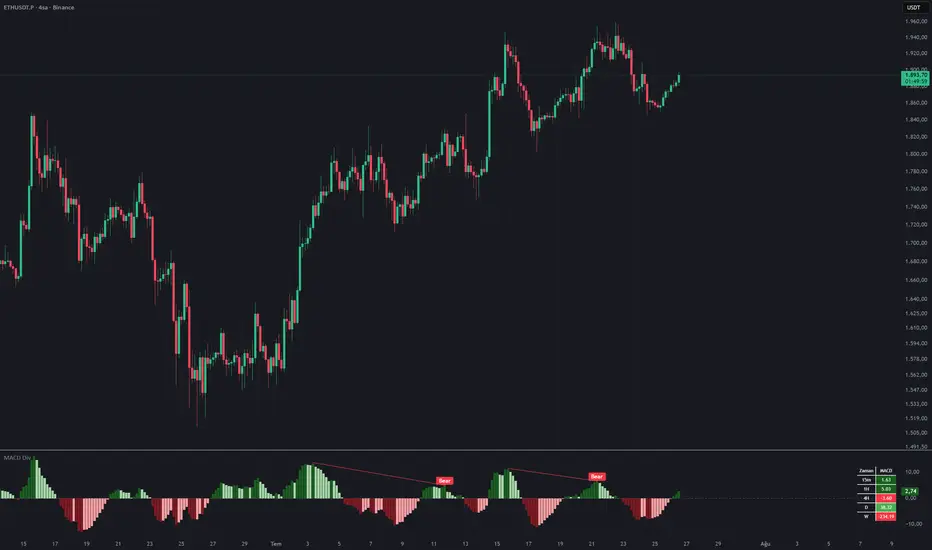
📊 MACD Histogram Divergence
MACD Histogram Divergence is a multi-mode momentum analysis indicator designed to detect regular divergences between price and the histogram of the selected oscillator. It supports MACD, MACD-V, PPO and PVO calculations and includes a five-timeframe table for monitoring oscillator direction and value across different market horizons.
⚙️ General Calculation:
The indicator uses the following common structure:
• Oscillator Value = Selected Oscillator Calculation
• Signal Line = Moving Average of the Oscillator Value
• Histogram = Oscillator Value − Signal Line
Default periods:
• Fast Period: 12
• Slow Period: 26
• Signal Period: 9
• ATR Period: 26
The selected settings are applied to both the chart histogram and all five rows of the multi-timeframe table.
📈 Oscillator Types:
The indicator includes four oscillator modes:
MACD: Classic MACD measures the absolute difference between two price-based moving averages. Its values therefore depend on the price scale of the analyzed instrument.
MACD = Fast Price MA − Slow Price MA
MACD-V: MACD-V normalizes the MACD difference by Average True Range. This reduces the effect of price scale and adjusts the oscillator according to current market volatility. The ATR Period setting is used only when MACD-V is selected.
MACD-V = ((Fast Price MA − Slow Price MA) ÷ ATR) × 100
PPO: The Percentage Price Oscillator expresses the difference between the fast and slow moving averages as a percentage of the slow moving average. This makes its values more comparable across instruments with different price levels.
PPO = ((Fast Price MA − Slow Price MA) ÷ Slow Price MA) × 100
PVO: The Percentage Volume Oscillator applies the same percentage structure to volume rather than price. It measures changes in volume momentum and can help identify whether participation is expanding or contracting.
PVO = ((Fast Volume MA − Slow Volume MA) ÷ Slow Volume MA) × 100
The Source setting applies to MACD, MACD-V and PPO. PVO is calculated directly from volume data.
〽️ Moving-Average Options:
The moving-average type can be selected independently for the oscillator and signal calculations. The Oscillator MA Type is used to calculate the fast and slow moving averages. The Signal MA Type is applied separately to the resulting oscillator value. This allows the response speed and smoothness of the oscillator and signal line to be adjusted independently.
• SMA – Simple Moving Average
• EMA – Exponential Moving Average
• WMA – Weighted Moving Average
• VWMA – Volume-Weighted Moving Average
• RMA – Running Moving Average
• HMA – Hull Moving Average
• TEMA – Triple Exponential Moving Average
🎨 Histogram Colors:
The histogram uses four colors to show both its position relative to zero and its current direction. This structure makes it possible to distinguish the sign of momentum from whether that momentum is strengthening or weakening.
🟢 Dark Green: Positive and rising
🟩 Light Green: Positive but falling
🟥 Light Red: Negative but rising
🔴 Dark Red: Negative and falling
🔍 Pivot-Based Divergence Detection:
Divergences are calculated using confirmed pivots of the selected oscillator’s histogram. The structure uses five bars on the left and five bars on the right of each pivot.
A divergence occurs when price forms a new extreme, but the selected histogram does not confirm that movement. The indicator compares confirmed price highs and lows with the corresponding histogram pivot points.
🟢 Regular Bullish Divergence:
Price forms a lower low while the oscillator histogram forms a higher low. This may indicate that bearish momentum is weakening despite the continued decline in price.
🔴 Regular Bearish Divergence:
Price forms a higher high while the oscillator histogram forms a lower high. This may indicate that bullish momentum is weakening despite the continued rise in price.
⏱️ Five-Timeframe Oscillator Table:
The indicator includes a five-row table on the right side of the chart. Each timeframe can be changed from the indicator settings.
Default timeframes:
• 15 Minutes
• 1 Hour
• 4 Hours
• Daily
• Weekly
The table displays the main value of the selected oscillator—not its histogram value. Its header automatically changes to MACD, MACD-V, PPO or PVO according to the selected mode.
Table colors represent both the position and direction of the oscillator:
🟢 Dark Green: Positive and rising
🟩 Green: Positive but falling
🔴 Dark Red: Negative and falling
🟥 Red: Negative but rising
⚪ Gray: Unchanged or unavailable
The table helps identify whether short-term and higher-timeframe momentum readings are aligned or conflicting.
🔔 Alert Conditions:
The indicator includes alert conditions for:
• Regular Bullish Divergence
• Regular Bearish Divergence
• Histogram crossing from positive to negative
• Histogram crossing from negative to positive
Alerts are calculated using the histogram of the currently selected oscillator.
🎯 How To Use:
This indicator is best used as a momentum confirmation tool rather than a standalone entry system.
A bullish divergence becomes more meaningful when it appears near an established support zone, after an extended decline or alongside a bullish market-structure change.
A bearish divergence becomes more meaningful when it appears near resistance, after an extended advance or alongside a bearish market-structure change.
MACD can be used for classic absolute momentum analysis, while MACD-V and PPO provide normalized alternatives. PVO focuses on volume momentum and may be used to evaluate whether changes in price are supported by changes in market participation.
The multi-timeframe table can then be used to determine whether the broader oscillator environment supports or conflicts with the divergence signal.
🛠️ Best Practices:
MACD Histogram Divergence works best when combined with:
• Market structure
• Support and resistance
• Price action
• Volume analysis
• Trend direction
• Liquidity zones
• Higher-timeframe context
⚠️ Important Notes:
This indicator detects regular divergences only. Hidden divergences are not included.
Divergence calculations always use the histogram of the selected oscillator.
Divergence signals require pivot confirmation and therefore appear after the five-bar right-side confirmation period has been completed.
MACD produces absolute values, while MACD-V, PPO and PVO produce normalized values. Their numerical readings should therefore not be interpreted on the same scale.
PVO depends on the availability and quality of volume data. It may return unavailable or less meaningful readings on instruments without reliable volume data.
Higher-timeframe table values can continue changing while their respective candles remain open.
A divergence represents a disagreement between price and momentum. It does not guarantee that a reversal will occur.
❗Disclaimer:
This indicator is intended for educational and analytical purposes only.
It is not financial advice and does not guarantee future market performance. Always use appropriate risk management and make your own trading decisions.
MACD Histogram Divergence is a multi-mode momentum analysis indicator designed to detect regular divergences between price and the histogram of the selected oscillator. It supports MACD, MACD-V, PPO and PVO calculations and includes a five-timeframe table for monitoring oscillator direction and value across different market horizons.
⚙️ General Calculation:
The indicator uses the following common structure:
• Oscillator Value = Selected Oscillator Calculation
• Signal Line = Moving Average of the Oscillator Value
• Histogram = Oscillator Value − Signal Line
Default periods:
• Fast Period: 12
• Slow Period: 26
• Signal Period: 9
• ATR Period: 26
The selected settings are applied to both the chart histogram and all five rows of the multi-timeframe table.
📈 Oscillator Types:
The indicator includes four oscillator modes:
MACD: Classic MACD measures the absolute difference between two price-based moving averages. Its values therefore depend on the price scale of the analyzed instrument.
MACD = Fast Price MA − Slow Price MA
MACD-V: MACD-V normalizes the MACD difference by Average True Range. This reduces the effect of price scale and adjusts the oscillator according to current market volatility. The ATR Period setting is used only when MACD-V is selected.
MACD-V = ((Fast Price MA − Slow Price MA) ÷ ATR) × 100
PPO: The Percentage Price Oscillator expresses the difference between the fast and slow moving averages as a percentage of the slow moving average. This makes its values more comparable across instruments with different price levels.
PPO = ((Fast Price MA − Slow Price MA) ÷ Slow Price MA) × 100
PVO: The Percentage Volume Oscillator applies the same percentage structure to volume rather than price. It measures changes in volume momentum and can help identify whether participation is expanding or contracting.
PVO = ((Fast Volume MA − Slow Volume MA) ÷ Slow Volume MA) × 100
The Source setting applies to MACD, MACD-V and PPO. PVO is calculated directly from volume data.
〽️ Moving-Average Options:
The moving-average type can be selected independently for the oscillator and signal calculations. The Oscillator MA Type is used to calculate the fast and slow moving averages. The Signal MA Type is applied separately to the resulting oscillator value. This allows the response speed and smoothness of the oscillator and signal line to be adjusted independently.
• SMA – Simple Moving Average
• EMA – Exponential Moving Average
• WMA – Weighted Moving Average
• VWMA – Volume-Weighted Moving Average
• RMA – Running Moving Average
• HMA – Hull Moving Average
• TEMA – Triple Exponential Moving Average
🎨 Histogram Colors:
The histogram uses four colors to show both its position relative to zero and its current direction. This structure makes it possible to distinguish the sign of momentum from whether that momentum is strengthening or weakening.
🟢 Dark Green: Positive and rising
🟩 Light Green: Positive but falling
🟥 Light Red: Negative but rising
🔴 Dark Red: Negative and falling
🔍 Pivot-Based Divergence Detection:
Divergences are calculated using confirmed pivots of the selected oscillator’s histogram. The structure uses five bars on the left and five bars on the right of each pivot.
A divergence occurs when price forms a new extreme, but the selected histogram does not confirm that movement. The indicator compares confirmed price highs and lows with the corresponding histogram pivot points.
🟢 Regular Bullish Divergence:
Price forms a lower low while the oscillator histogram forms a higher low. This may indicate that bearish momentum is weakening despite the continued decline in price.
🔴 Regular Bearish Divergence:
Price forms a higher high while the oscillator histogram forms a lower high. This may indicate that bullish momentum is weakening despite the continued rise in price.
⏱️ Five-Timeframe Oscillator Table:
The indicator includes a five-row table on the right side of the chart. Each timeframe can be changed from the indicator settings.
Default timeframes:
• 15 Minutes
• 1 Hour
• 4 Hours
• Daily
• Weekly
The table displays the main value of the selected oscillator—not its histogram value. Its header automatically changes to MACD, MACD-V, PPO or PVO according to the selected mode.
Table colors represent both the position and direction of the oscillator:
🟢 Dark Green: Positive and rising
🟩 Green: Positive but falling
🔴 Dark Red: Negative and falling
🟥 Red: Negative but rising
⚪ Gray: Unchanged or unavailable
The table helps identify whether short-term and higher-timeframe momentum readings are aligned or conflicting.
🔔 Alert Conditions:
The indicator includes alert conditions for:
• Regular Bullish Divergence
• Regular Bearish Divergence
• Histogram crossing from positive to negative
• Histogram crossing from negative to positive
Alerts are calculated using the histogram of the currently selected oscillator.
🎯 How To Use:
This indicator is best used as a momentum confirmation tool rather than a standalone entry system.
A bullish divergence becomes more meaningful when it appears near an established support zone, after an extended decline or alongside a bullish market-structure change.
A bearish divergence becomes more meaningful when it appears near resistance, after an extended advance or alongside a bearish market-structure change.
MACD can be used for classic absolute momentum analysis, while MACD-V and PPO provide normalized alternatives. PVO focuses on volume momentum and may be used to evaluate whether changes in price are supported by changes in market participation.
The multi-timeframe table can then be used to determine whether the broader oscillator environment supports or conflicts with the divergence signal.
🛠️ Best Practices:
MACD Histogram Divergence works best when combined with:
• Market structure
• Support and resistance
• Price action
• Volume analysis
• Trend direction
• Liquidity zones
• Higher-timeframe context
⚠️ Important Notes:
This indicator detects regular divergences only. Hidden divergences are not included.
Divergence calculations always use the histogram of the selected oscillator.
Divergence signals require pivot confirmation and therefore appear after the five-bar right-side confirmation period has been completed.
MACD produces absolute values, while MACD-V, PPO and PVO produce normalized values. Their numerical readings should therefore not be interpreted on the same scale.
PVO depends on the availability and quality of volume data. It may return unavailable or less meaningful readings on instruments without reliable volume data.
Higher-timeframe table values can continue changing while their respective candles remain open.
A divergence represents a disagreement between price and momentum. It does not guarantee that a reversal will occur.
❗Disclaimer:
This indicator is intended for educational and analytical purposes only.
It is not financial advice and does not guarantee future market performance. Always use appropriate risk management and make your own trading decisions.
受保護腳本
此腳本以閉源形式發佈。 不過,您可以自由使用,沒有任何限制 — 點擊此處了解更多。

免責聲明
這些資訊和出版物並非旨在提供,也不構成TradingView提供或認可的任何形式的財務、投資、交易或其他類型的建議或推薦。請閱讀使用條款以了解更多資訊。
免責聲明
這些資訊和出版物並非旨在提供,也不構成TradingView提供或認可的任何形式的財務、投資、交易或其他類型的建議或推薦。請閱讀使用條款以了解更多資訊。