已更新
ATR Move Multiple (X Days)
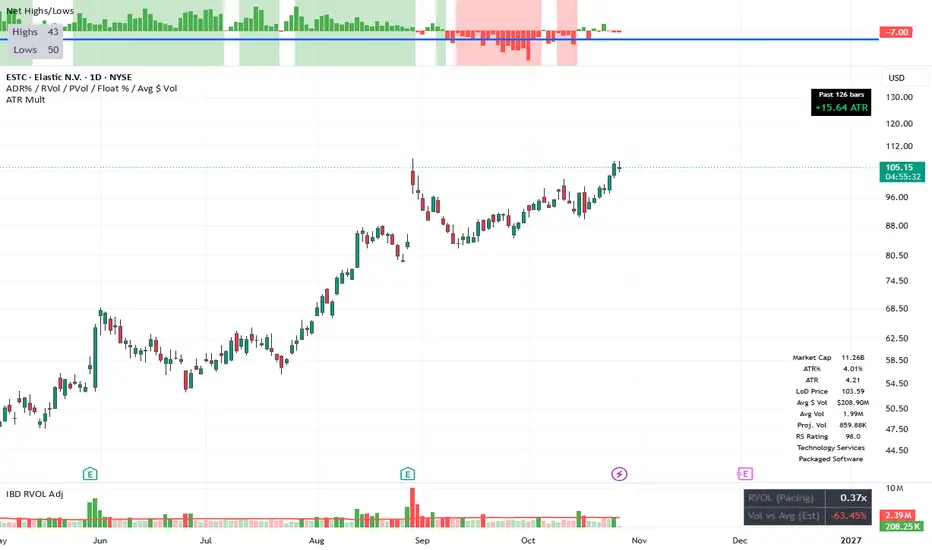
This indicator shows how far a stock (or any ticker) has moved over a chosen number of bars, measured in units of its own average true range (ATR).
It takes the price change from X bars ago to the current bar, divides that change by the ATR (which you can set to any length, default 100), and displays the result as a simple number. A reading of +2.5 means the price is up 2.5 ATRs over that lookback period; –1.8 means it is down 1.8 ATRs.
The number appears in a small table on the chart. You can adjust the lookback length, the ATR period, and the table’s appearance (size, colors, position, border) directly in the indicator settings.
It takes the price change from X bars ago to the current bar, divides that change by the ATR (which you can set to any length, default 100), and displays the result as a simple number. A reading of +2.5 means the price is up 2.5 ATRs over that lookback period; –1.8 means it is down 1.8 ATRs.
The number appears in a small table on the chart. You can adjust the lookback length, the ATR period, and the table’s appearance (size, colors, position, border) directly in the indicator settings.
發行說明
Added a space above the table so that it wouldn't be blocked by TradingView's built in arrows when hovering your mouse on the chart. 
免責聲明
這些資訊和出版物並非旨在提供,也不構成TradingView提供或認可的任何形式的財務、投資、交易或其他類型的建議或推薦。請閱讀使用條款以了解更多資訊。
免責聲明
這些資訊和出版物並非旨在提供,也不構成TradingView提供或認可的任何形式的財務、投資、交易或其他類型的建議或推薦。請閱讀使用條款以了解更多資訊。