OPEN-SOURCE SCRIPT
LRLR & HRLR Liquidity Runs V2
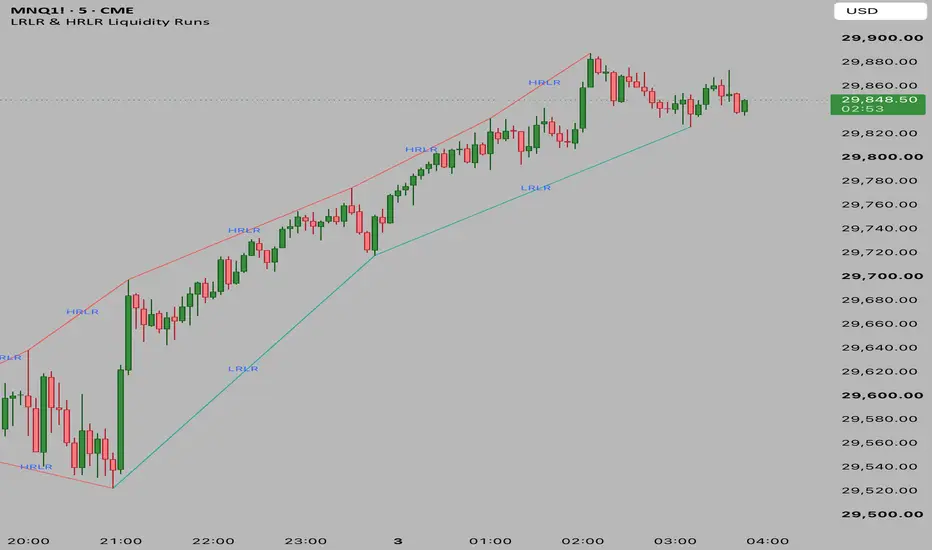
Its primary purpose is to automatically identify, classify, and connect consecutive swing highs and swing lows to highlight potential Liquidity Runs based on ICT/Smart Money Concepts.
Here is a breakdown of how it works:
1. Pivot Identification
The script relies on identifying structural pivot points (swing highs and lows).
It uses ta.pivothigh and ta.pivotlow to find these points.
By default, a pivot is confirmed if the price is the highest/lowest point compared to the 5 bars on its left and 5 bars on its right (customizable via leftBars and rightBars inputs).
2. Core Logic (LRLR vs HRLR)
Once a new pivot is identified, the script compares it to the immediate previous pivot of the same type to classify the resistance of the liquidity run:
For Pivot Highs (Resistance/Tops):
LRLR (Low Resistance Liquidity Run): If the new Pivot High is Lower than or Equal to the previous Pivot High. (Price failed to break the previous high, leaving clean liquidity above).
HRLR (High Resistance Liquidity Run): If the new Pivot High is Higher than the previous Pivot High. (Price successfully broke the previous high, taking out the liquidity).
For Pivot Lows (Support/Bottoms):
LRLR (Low Resistance Liquidity Run): If the new Pivot Low is Higher than or Equal to the previous Pivot Low. (Price failed to break the previous low, leaving clean liquidity below).
HRLR (High Resistance Liquidity Run): If the new Pivot Low is Lower than the previous Pivot Low. (Price successfully broke the previous low, taking out the liquidity).
3. Visual Output
Whenever a new pivot is confirmed, the script draws a Line connecting the previous pivot to the new pivot.
The color of the line changes based on whether it's an LRLR (default Greenish) or an HRLR (default Reddish).
A Text Label ("LRLR" or "HRLR") is plotted precisely at the midpoint of the line for easy visual identification.
Here is a breakdown of how it works:
1. Pivot Identification
The script relies on identifying structural pivot points (swing highs and lows).
It uses ta.pivothigh and ta.pivotlow to find these points.
By default, a pivot is confirmed if the price is the highest/lowest point compared to the 5 bars on its left and 5 bars on its right (customizable via leftBars and rightBars inputs).
2. Core Logic (LRLR vs HRLR)
Once a new pivot is identified, the script compares it to the immediate previous pivot of the same type to classify the resistance of the liquidity run:
For Pivot Highs (Resistance/Tops):
LRLR (Low Resistance Liquidity Run): If the new Pivot High is Lower than or Equal to the previous Pivot High. (Price failed to break the previous high, leaving clean liquidity above).
HRLR (High Resistance Liquidity Run): If the new Pivot High is Higher than the previous Pivot High. (Price successfully broke the previous high, taking out the liquidity).
For Pivot Lows (Support/Bottoms):
LRLR (Low Resistance Liquidity Run): If the new Pivot Low is Higher than or Equal to the previous Pivot Low. (Price failed to break the previous low, leaving clean liquidity below).
HRLR (High Resistance Liquidity Run): If the new Pivot Low is Lower than the previous Pivot Low. (Price successfully broke the previous low, taking out the liquidity).
3. Visual Output
Whenever a new pivot is confirmed, the script draws a Line connecting the previous pivot to the new pivot.
The color of the line changes based on whether it's an LRLR (default Greenish) or an HRLR (default Reddish).
A Text Label ("LRLR" or "HRLR") is plotted precisely at the midpoint of the line for easy visual identification.
開源腳本
秉持TradingView一貫精神,這個腳本的創作者將其設為開源,以便交易者檢視並驗證其功能。向作者致敬!您可以免費使用此腳本,但請注意,重新發佈代碼需遵守我們的社群規範。

免責聲明
這些資訊和出版物並非旨在提供,也不構成TradingView提供或認可的任何形式的財務、投資、交易或其他類型的建議或推薦。請閱讀使用條款以了解更多資訊。
免責聲明
這些資訊和出版物並非旨在提供,也不構成TradingView提供或認可的任何形式的財務、投資、交易或其他類型的建議或推薦。請閱讀使用條款以了解更多資訊。