OPEN-SOURCE SCRIPT
RSI Pro - Kiyotaka
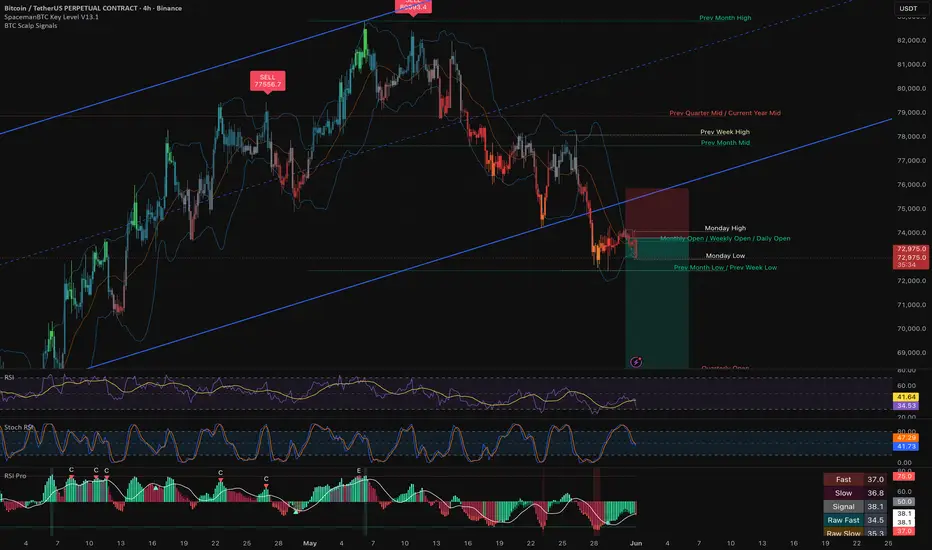
The RSI Pro is a D/7R-inspired advanced momentum oscillator that upgrades the standard Relative Strength Index (RSI). Instead of a single, jagged line that often gives false signals, this indicator smooths the data and uses multiple moving averages to create a visual
"Ribbon." It is designed to help traders identify trend strength and reversals without the noise associated with a standard RSI.
How It Works:
Dual RSIs: It calculates two RSIs:
Fast RSI (14): Reacts quickly to price changes.
Slow RSI (20): Reacts slower, filtering out noise.
Smoothing: Both RSls are smoothed using an EMA (Exponential Moving Average) to remove the jagged "jitters" of raw price action.
The Signal Line: A baseline (SMA) is plotted. The "Ribbon" is the shaded area between the RSIs and this Signal Line.
Green Ribbon: The RSI is above the Signal Line (Bullish Momentum).
Red Ribbon: The RSI is below the Signal Line (Bearish Momentum).
"Ribbon." It is designed to help traders identify trend strength and reversals without the noise associated with a standard RSI.
How It Works:
Dual RSIs: It calculates two RSIs:
Fast RSI (14): Reacts quickly to price changes.
Slow RSI (20): Reacts slower, filtering out noise.
Smoothing: Both RSls are smoothed using an EMA (Exponential Moving Average) to remove the jagged "jitters" of raw price action.
The Signal Line: A baseline (SMA) is plotted. The "Ribbon" is the shaded area between the RSIs and this Signal Line.
Green Ribbon: The RSI is above the Signal Line (Bullish Momentum).
Red Ribbon: The RSI is below the Signal Line (Bearish Momentum).
開源腳本
秉持TradingView一貫精神,這個腳本的創作者將其設為開源,以便交易者檢視並驗證其功能。向作者致敬!您可以免費使用此腳本,但請注意,重新發佈代碼需遵守我們的社群規範。

免責聲明
這些資訊和出版物並非旨在提供,也不構成TradingView提供或認可的任何形式的財務、投資、交易或其他類型的建議或推薦。請閱讀使用條款以了解更多資訊。
免責聲明
這些資訊和出版物並非旨在提供,也不構成TradingView提供或認可的任何形式的財務、投資、交易或其他類型的建議或推薦。請閱讀使用條款以了解更多資訊。