OPEN-SOURCE SCRIPT
Altan TV Bot V1 - EMA Signal Indicator
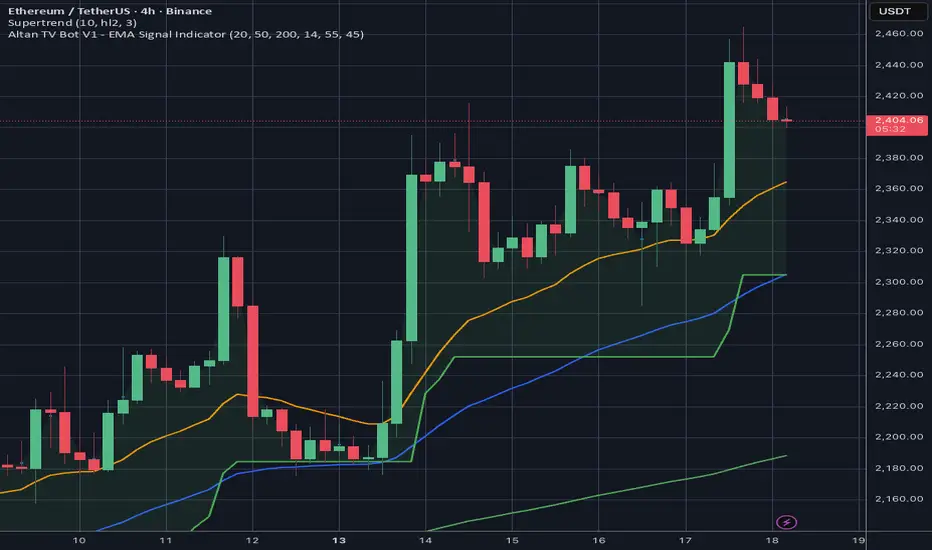
📊 ALTAN TV BOT V1 — Multi-Layer EMA Crossover with RSI & Trend Filter
A professional-grade signal indicator that combines classic EMA crossover
logic with RSI momentum confirmation and long-term trend filtering. Designed
to reduce false signals through a three-stage confirmation mechanism, making
it especially suitable for trending markets and crypto pairs.
This indicator is webhook-ready and integrates directly with automated
trading bots via JSON-formatted alert messages.
═══════════════════════════════════════════════════════════
🎯 CORE CONCEPT
Most EMA crossover strategies suffer from whipsaws in ranging markets.
This indicator addresses that weakness by requiring THREE independent
confirmations before generating a signal:
1. Momentum Shift — Fast EMA crosses Slow EMA
2. Momentum Strength — RSI confirms the directional bias
3. Trend Alignment — Price is on the correct side of the 200 EMA
Only when all three align does the indicator emit a signal. This
significantly reduces noise while preserving the core benefit of EMA
crossovers: early trend entry.
═══════════════════════════════════════════════════════════
⚙️ INDICATOR COMPONENTS
- Fast EMA (20) — Short-term price momentum
Tracks immediate directional bias and reacts quickly to price action.
- Slow EMA (50) — Medium-term trend direction
Smooths short-term noise and defines the dominant swing direction.
- Trend EMA (200) — Long-term trend filter
Acts as the structural trend anchor. Signals only fire in the
direction of this long-term trend.
- RSI (14) — Momentum strength confirmation
Filters out weak crossovers by requiring meaningful momentum
(>55 for longs, <45 for shorts).
═══════════════════════════════════════════════════════════
📈 SIGNAL LOGIC
LONG ENTRY — All three conditions must be true simultaneously:
✓ Fast EMA (20) crosses ABOVE Slow EMA (50)
✓ RSI (14) is ABOVE 55
✓ Close price is ABOVE Trend EMA (200)
SHORT ENTRY — All three conditions must be true simultaneously:
✓ Fast EMA (20) crosses BELOW Slow EMA (50)
✓ RSI (14) is BELOW 45
✓ Close price is BELOW Trend EMA (200)
Why these specific thresholds?
— RSI 55/45 (instead of classic 70/30) catches momentum EARLIER,
before the move becomes overextended.
— EMA 200 filter ensures alignment with structural trend, preventing
counter-trend entries that often fail.
— Crossover requirement (not just "above/below") ensures the signal
is a FRESH momentum shift, not a late entry.
═══════════════════════════════════════════════════════════
🔔 WEBHOOK-READY ALERT SYSTEM
The indicator includes two pre-configured alert conditions that emit
JSON payloads compatible with automated trading systems:
{
"bot_id": "tv_ema_breakout_v1",
"symbol": "{{ticker}}",
"timeframe": "{{interval}}",
"action": "long_entry" | "short_entry",
"price": "{{close}}",
"timestamp": "{{timenow}}"
}
This payload is production-tested and works with:
• Alpaca (paper and live trading APIs)
• Hyperliquid (DEX spot/perp execution)
• Binance (spot trading via webhook)
• Custom Python/Node.js webhook receivers
• Any system that parses JSON webhook payloads
The payload structure keeps integration minimal — your backend only
needs to parse 5 fields to execute a trade.
═══════════════════════════════════════════════════════════
📋 USER-ADJUSTABLE PARAMETERS
┌─────────────────────┬─────────┬──────────────────────────┐
│ Parameter │ Default │ Recommended Range │
├─────────────────────┼─────────┼──────────────────────────┤
│ Fast EMA │ 20 │ 10-30 │
│ Slow EMA │ 50 │ 30-100 │
│ Trend EMA │ 200 │ 100-300 │
│ RSI Length │ 14 │ 10-21 (standard) │
│ RSI Bull Threshold │ 55 │ 50-65 │
│ RSI Bear Threshold │ 45 │ 35-50 │
└─────────────────────┴─────────┴──────────────────────────┘
Suggested parameter sets:
🐢 CONSERVATIVE (fewer signals, higher quality)
Fast 20 / Slow 50 / Trend 200 / RSI 60/40
⚖️ BALANCED (default)
Fast 20 / Slow 50 / Trend 200 / RSI 55/45
🐆 AGGRESSIVE (more signals, more noise)
Fast 12 / Slow 26 / Trend 100 / RSI 52/48
═══════════════════════════════════════════════════════════
💡 BEST PRACTICES
Recommended Timeframes:
• 4H — Best balance between signal frequency and quality
• 1D — Highest quality signals for position trading
• 1H — Acceptable for active swing traders
• 15m — Use with caution; significant noise in crypto markets
• <15m — NOT recommended; false signal rate too high
Recommended Markets:
✓ Trending crypto pairs (BTC, ETH, SOL) on major exchanges
✓ Large-cap stocks with clear trends
✓ Forex majors during trending sessions
✗ Ranging/choppy markets — expect whipsaws
✗ Low-liquidity altcoins — noise dominates signal
Risk Management:
This indicator is a SIGNAL generator, not a complete trading system.
Always combine with:
• Position sizing rules (1-2% risk per trade)
• Stop-loss placement (below recent swing low for longs)
• Take-profit targets (ATR-based or resistance levels)
• Market regime awareness (don't short during strong bull trends)
═══════════════════════════════════════════════════════════
🎨 VISUAL OUTPUT
The indicator plots three EMAs directly on the chart:
• Fast EMA (20) — Orange line (2px)
• Slow EMA (50) — Blue line (2px)
• Trend EMA (200) — Green line (2px)
Signal labels appear at bar close:
🟢 BUY label below the bar (on long entry)
🔴 SELL label above the bar (on short entry)
The EMA arrangement alone provides visual context:
• Bullish alignment: Orange > Blue > Green (price above all)
• Bearish alignment: Green > Blue > Orange (price below all)
• Transition zones: EMAs converging/crossing signal regime change
═══════════════════════════════════════════════════════════
🔬 BACKTESTING NOTES
This indicator does NOT include a built-in strategy tester to remain
lightweight and performant. For backtesting:
1. Copy the signal conditions into a Pine Script strategy template
2. Add entry/exit logic with your preferred risk rules
3. Use TradingView's Strategy Tester with realistic commission/slippage
Observed historical performance (anecdotal, not guaranteed):
• Crypto 4H trending periods: ~55-65% signal accuracy
• Ranging periods: ~30-40% (as expected — avoid these)
• Stock market daily: ~50-58% with longer holding periods
═══════════════════════════════════════════════════════════
🛠️ VERSION HISTORY
v1.0 (Current)
• Initial release
• Three-stage confirmation logic
• Webhook-ready JSON alerts
• User-adjustable parameters
• Dark-theme optimized plot colors
Planned for v2:
• ATR-based dynamic RSI thresholds
• Multi-timeframe confirmation (higher TF trend filter)
• Volume confirmation filter
• Divergence detection
═══════════════════════════════════════════════════════════
⚠️ DISCLAIMER
This indicator is provided for educational and informational purposes
only. It does not constitute financial, investment, or trading advice.
Trading financial markets carries substantial risk and may not be
suitable for all investors.
Past performance is not indicative of future results. Always perform
your own analysis, backtest thoroughly on historical data, and never
risk capital you cannot afford to lose. Consult a licensed financial
advisor before making investment decisions.
The author is not responsible for any losses incurred through the
use of this indicator, whether directly or via automated systems
connected through its webhook alerts.
═══════════════════════════════════════════════════════════
👤 ABOUT THE AUTHOR
Created by Altan Tan as part of a broader algorithmic trading research
project focused on multi-model ensemble decision systems for crypto
markets. This indicator represents the rule-based technical analysis
layer of a larger system that combines machine learning (LightGBM,
XGBoost, LSTM), market regime detection (Hidden Markov Models), and
sentiment analysis.
Feedback, suggestions, and bug reports are welcome in the comments.
═══════════════════════════════════════════════════════════
📌 TAGS
#ema #crossover #rsi #trend #momentum #webhook #automation #bot
#crypto #btc #eth #stocks #forex #signals #multitimeframe
開源腳本
秉持TradingView一貫精神,這個腳本的創作者將其設為開源,以便交易者檢視並驗證其功能。向作者致敬!您可以免費使用此腳本,但請注意,重新發佈代碼需遵守我們的社群規範。

免責聲明
這些資訊和出版物並非旨在提供,也不構成TradingView提供或認可的任何形式的財務、投資、交易或其他類型的建議或推薦。請閱讀使用條款以了解更多資訊。
開源腳本
秉持TradingView一貫精神,這個腳本的創作者將其設為開源,以便交易者檢視並驗證其功能。向作者致敬!您可以免費使用此腳本,但請注意,重新發佈代碼需遵守我們的社群規範。
免責聲明
這些資訊和出版物並非旨在提供,也不構成TradingView提供或認可的任何形式的財務、投資、交易或其他類型的建議或推薦。請閱讀使用條款以了解更多資訊。