OPEN-SOURCE SCRIPT
N-Touch Trendline Breakout
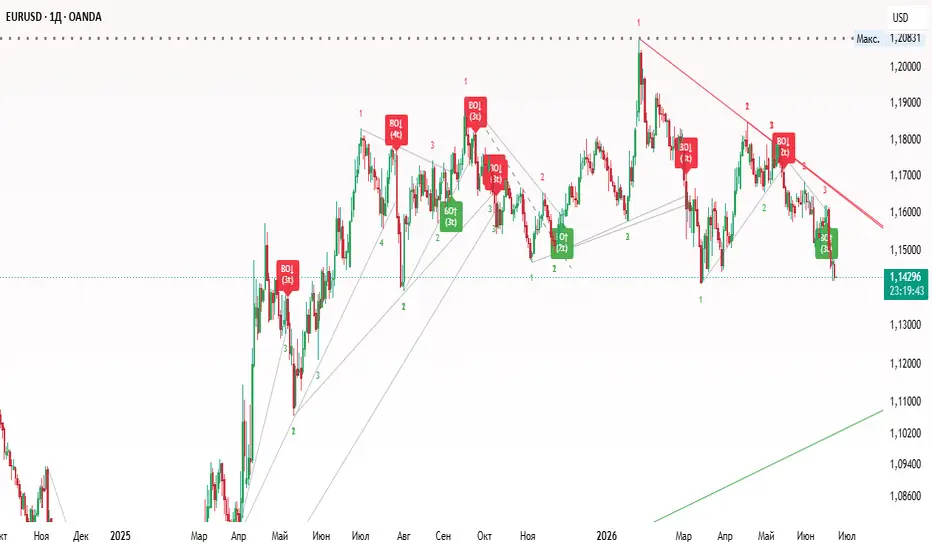
I've created an indicator that identifies support and resistance levels based on pivots and tracks how many times price interacts with them before breaking out.
Here is how it works:
1. Pivot Identification: It looks for pivot highs (resistance) and pivot lows (support) to establish levels.
2. Touch Tracking: When the price comes within the Touch Tolerance % of an active level (but doesn't break and close past it), it registers a "touch" and displays the count as tiny text on the chart.
3. Breakout Detection: If the price breaks through the level (closing above resistance or below support), it checks the touch count. If the required number of touches (default is 3) has been met or exceeded, it triggers a "BO" (Breakout) label with an arrow.
You can customize the following settings in the indicator inputs:
1. Pivot Length: Adjusts how many bars are used to define a pivot. A higher value will find more significant long-term levels.
2. Required Touches: The minimum number of interactions required before a breakout signal is valid.
3. Touch Tolerance %: Defines how close the price must get to the level to be considered a touch.
-Initial Touches: The two pivot points used to create the trendline automatically count as the first 2 touches.
-Future Touches: As the trendline extends into the future, any time the price comes within the Touch Tolerance % of the line without breaking it, a new touch is registered and displayed as a small number on the chart.
-Breakout Detection: If the price breaks through the extended trendline (closing above resistance or below support), the script checks the touch count. If it meets or exceeds your Required Touches setting (default is 3, which means the 2 pivots + 1 additional touch), it signals a breakout.
Clean Touch Numbers: The number 3 (and any subsequent numbers) will only print once per actual swing touch, keeping your chart nice and clean.
Here is how it works:
1. Pivot Identification: It looks for pivot highs (resistance) and pivot lows (support) to establish levels.
2. Touch Tracking: When the price comes within the Touch Tolerance % of an active level (but doesn't break and close past it), it registers a "touch" and displays the count as tiny text on the chart.
3. Breakout Detection: If the price breaks through the level (closing above resistance or below support), it checks the touch count. If the required number of touches (default is 3) has been met or exceeded, it triggers a "BO" (Breakout) label with an arrow.
You can customize the following settings in the indicator inputs:
1. Pivot Length: Adjusts how many bars are used to define a pivot. A higher value will find more significant long-term levels.
2. Required Touches: The minimum number of interactions required before a breakout signal is valid.
3. Touch Tolerance %: Defines how close the price must get to the level to be considered a touch.
-Initial Touches: The two pivot points used to create the trendline automatically count as the first 2 touches.
-Future Touches: As the trendline extends into the future, any time the price comes within the Touch Tolerance % of the line without breaking it, a new touch is registered and displayed as a small number on the chart.
-Breakout Detection: If the price breaks through the extended trendline (closing above resistance or below support), the script checks the touch count. If it meets or exceeds your Required Touches setting (default is 3, which means the 2 pivots + 1 additional touch), it signals a breakout.
Clean Touch Numbers: The number 3 (and any subsequent numbers) will only print once per actual swing touch, keeping your chart nice and clean.
開源腳本
秉持TradingView一貫精神,這個腳本的創作者將其設為開源,以便交易者檢視並驗證其功能。向作者致敬!您可以免費使用此腳本,但請注意,重新發佈代碼需遵守我們的社群規範。

免責聲明
這些資訊和出版物並非旨在提供,也不構成TradingView提供或認可的任何形式的財務、投資、交易或其他類型的建議或推薦。請閱讀使用條款以了解更多資訊。
免責聲明
這些資訊和出版物並非旨在提供,也不構成TradingView提供或認可的任何形式的財務、投資、交易或其他類型的建議或推薦。請閱讀使用條款以了解更多資訊。