OPEN-SOURCE SCRIPT
RSI Pullback Finder Trend-Filtered oversold dips in an up
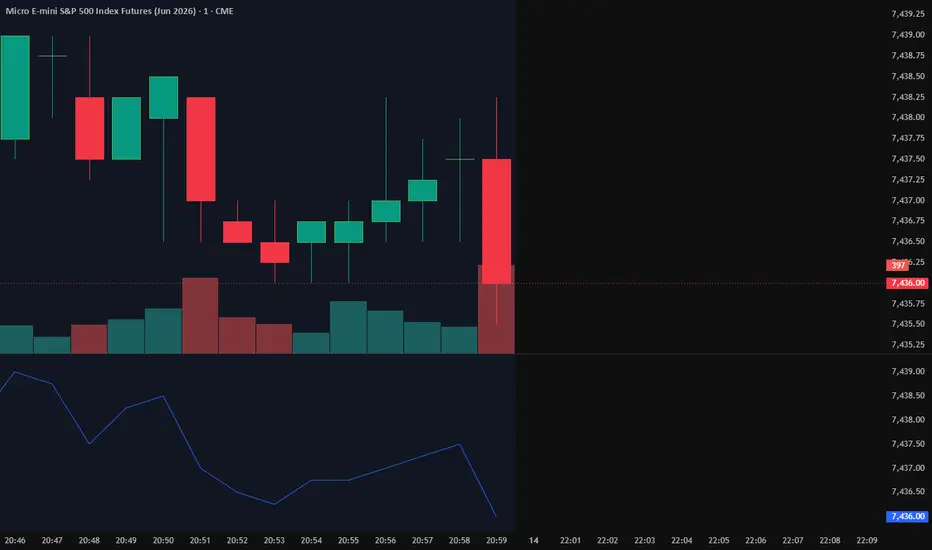
A clean, fully-configurable tool that highlights short-term oversold pullbacks while price is still in an uptrend — the classic "buy the dip in an uptrend" context. Visual signals + alerts. Educational, not financial advice.
RSI(2) Pullback Finder highlights one specific, well-known context: a short-term oversold pullback that happens WHILE price is still in an uptrend. This is the classic Larry-Connors-style "short-term mean reversion inside a longer-term uptrend" idea, turned into a clean visual + alert layer.
WHAT IT MARKS: Trend filter — price above a moving average you choose (default EMA 50). Oversold pullback — a short RSI (default length 2) dropping below a level you choose (default 10). When both are true on the same bar, the bar is shaded and a signal plots. Optional "context cleared" marker shows where the short-term oversold condition has resolved.
EVERYTHING IS CONFIGURABLE: MA type and length, RSI length and source, oversold level, reset level, fast MA, and all display toggles. Defaults are generic textbook values on purpose — tune them to your instrument and timeframe.
HOW TO USE: Treat a signal as "this setup is present right now," then apply your own entry rules, position sizing, and risk management. Use the built-in alerts to scan instead of staring at charts. Works on any symbol or timeframe.
WHAT IT IS NOT: It does not place trades, predict direction, or guarantee anything. It is a visualisation and alert tool. Past behaviour of any pattern does not predict future results. For education and research only — not financial advice, and I am not a financial adviser. Trade your own plan and your own risk.
Open-source — read the code, fork it, adapt it. Feedback welcome in the comments.
RSI(2) Pullback Finder highlights one specific, well-known context: a short-term oversold pullback that happens WHILE price is still in an uptrend. This is the classic Larry-Connors-style "short-term mean reversion inside a longer-term uptrend" idea, turned into a clean visual + alert layer.
WHAT IT MARKS: Trend filter — price above a moving average you choose (default EMA 50). Oversold pullback — a short RSI (default length 2) dropping below a level you choose (default 10). When both are true on the same bar, the bar is shaded and a signal plots. Optional "context cleared" marker shows where the short-term oversold condition has resolved.
EVERYTHING IS CONFIGURABLE: MA type and length, RSI length and source, oversold level, reset level, fast MA, and all display toggles. Defaults are generic textbook values on purpose — tune them to your instrument and timeframe.
HOW TO USE: Treat a signal as "this setup is present right now," then apply your own entry rules, position sizing, and risk management. Use the built-in alerts to scan instead of staring at charts. Works on any symbol or timeframe.
WHAT IT IS NOT: It does not place trades, predict direction, or guarantee anything. It is a visualisation and alert tool. Past behaviour of any pattern does not predict future results. For education and research only — not financial advice, and I am not a financial adviser. Trade your own plan and your own risk.
Open-source — read the code, fork it, adapt it. Feedback welcome in the comments.
開源腳本
秉持TradingView一貫精神,這個腳本的創作者將其設為開源,以便交易者檢視並驗證其功能。向作者致敬!您可以免費使用此腳本,但請注意,重新發佈代碼需遵守我們的社群規範。

免責聲明
這些資訊和出版物並非旨在提供,也不構成TradingView提供或認可的任何形式的財務、投資、交易或其他類型的建議或推薦。請閱讀使用條款以了解更多資訊。
開源腳本
秉持TradingView一貫精神,這個腳本的創作者將其設為開源,以便交易者檢視並驗證其功能。向作者致敬!您可以免費使用此腳本,但請注意,重新發佈代碼需遵守我們的社群規範。
免責聲明
這些資訊和出版物並非旨在提供,也不構成TradingView提供或認可的任何形式的財務、投資、交易或其他類型的建議或推薦。請閱讀使用條款以了解更多資訊。