OPEN-SOURCE SCRIPT
c-c/MA (Simplified 2-Color)
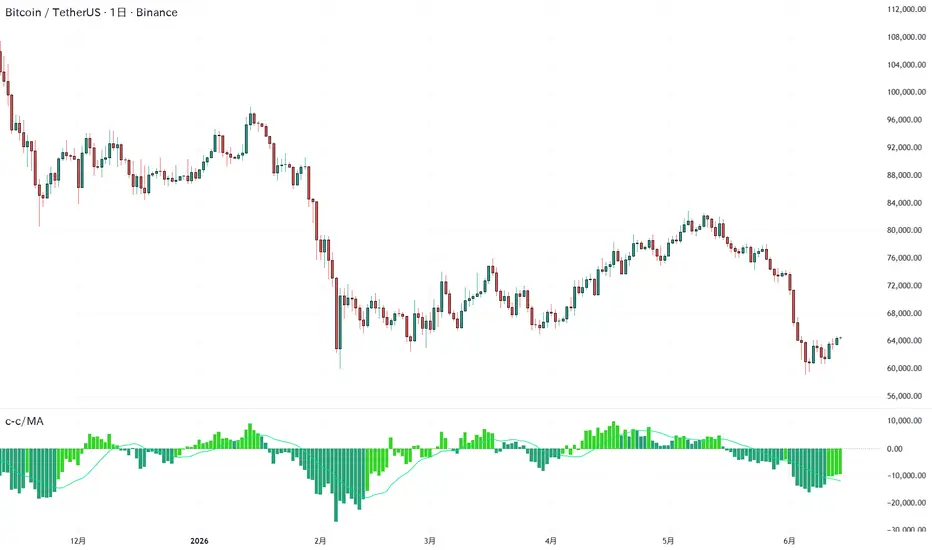
c-c/MA (Simplified 2-Color)
This indicator is a simple momentum analysis tool that visualizes price movement by comparing the current price with the price from a specified number of periods ago.
It displays the price difference as a histogram and applies a Simple Moving Average (SMA) to help identify trend strength and momentum shifts.
Features
Price Difference (c-c)
The indicator calculates the difference between the current closing price and the closing price from a specified number of bars ago:
* Positive values indicate that the current price is higher than the past price.
* Negative values indicate that the current price is lower than the past price.
SMA Smoothing
A Simple Moving Average (SMA) is applied to the histogram to smooth short-term fluctuations and highlight the overall momentum trend.
Two-Color Histogram
The histogram changes color based on its relationship to the SMA:
* Above SMA: Indicates relatively stronger momentum.
* Below SMA: Indicates weaker or slowing momentum.
Zero Line
The zero line represents the point where the current price equals the price from the selected lookback period:
* Above zero: Bullish momentum.
* Below zero: Bearish momentum.
How to Use
This indicator can be used to:
* Identify trend direction
* Evaluate momentum strength
* Detect potential trend shifts
* Complement other indicators such as RSI, volume analysis, or moving averages
Note: This indicator is designed as a supporting analytical tool and should be used alongside other forms of market analysis and risk management.
This indicator is a simple momentum analysis tool that visualizes price movement by comparing the current price with the price from a specified number of periods ago.
It displays the price difference as a histogram and applies a Simple Moving Average (SMA) to help identify trend strength and momentum shifts.
Features
Price Difference (c-c)
The indicator calculates the difference between the current closing price and the closing price from a specified number of bars ago:
* Positive values indicate that the current price is higher than the past price.
* Negative values indicate that the current price is lower than the past price.
SMA Smoothing
A Simple Moving Average (SMA) is applied to the histogram to smooth short-term fluctuations and highlight the overall momentum trend.
Two-Color Histogram
The histogram changes color based on its relationship to the SMA:
* Above SMA: Indicates relatively stronger momentum.
* Below SMA: Indicates weaker or slowing momentum.
Zero Line
The zero line represents the point where the current price equals the price from the selected lookback period:
* Above zero: Bullish momentum.
* Below zero: Bearish momentum.
How to Use
This indicator can be used to:
* Identify trend direction
* Evaluate momentum strength
* Detect potential trend shifts
* Complement other indicators such as RSI, volume analysis, or moving averages
Note: This indicator is designed as a supporting analytical tool and should be used alongside other forms of market analysis and risk management.
開源腳本
秉持TradingView一貫精神,這個腳本的創作者將其設為開源,以便交易者檢視並驗證其功能。向作者致敬!您可以免費使用此腳本,但請注意,重新發佈代碼需遵守我們的社群規範。

免責聲明
這些資訊和出版物並非旨在提供,也不構成TradingView提供或認可的任何形式的財務、投資、交易或其他類型的建議或推薦。請閱讀使用條款以了解更多資訊。
免責聲明
這些資訊和出版物並非旨在提供,也不構成TradingView提供或認可的任何形式的財務、投資、交易或其他類型的建議或推薦。請閱讀使用條款以了解更多資訊。