OPEN-SOURCE SCRIPT
已更新 Volatility Drag Oscillator
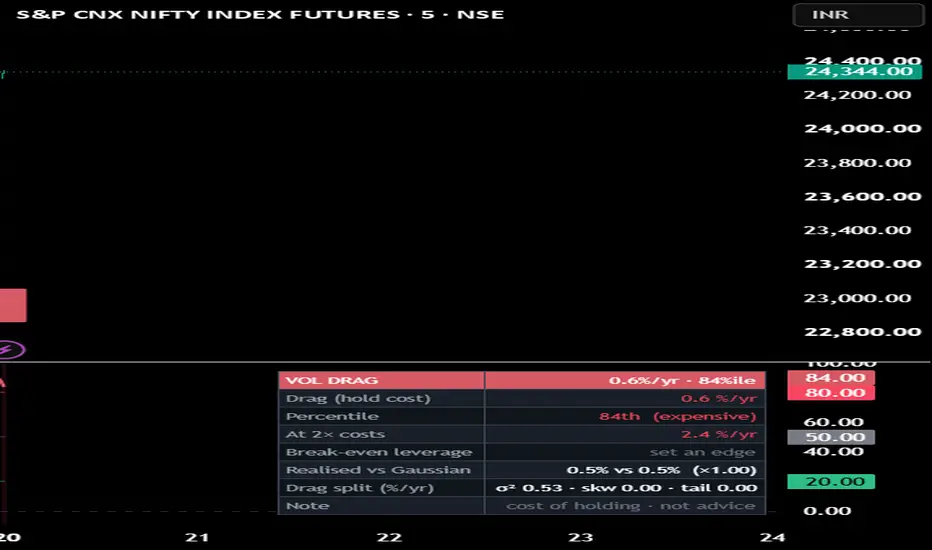
Volatility Drag Oscillator — what is holding exposure costing you, and what does leverage do to it?
Compound growth is g = μ − σ²/2; under leverage, g(L) = L·μ − L²·σ²/2. Return scales with L, drag scales
with L² — which is the whole reason leverage does not raise your probability of success. Volatility is
estimable in hundreds of bars; drift needs decades. So this tool measures only the knowable half:
- DRAG = σ²/2 annualised (Yang-Zhang by default; Close-to-close / Parkinson / Garman-Klass /
Rogers-Satchell selectable to see estimator disagreement = gap-risk information), EWMA-smoothed and
ranked into a percentile so you know if today is a cheap or expensive time to hold.
- DRAG DECOMPOSITION — realised drag split into its exact cumulant pieces: variance (σ²/2) + skew +
excess-kurtosis, shown as "σ² · skw · tail" in %/yr. A fat-tail warning tells you HOW MUCH of your
drag is tails, not just that they exist — and it compares realised drag to its own Gaussian part, so
it can't be fooled by estimator choice.
- LEVERAGE CURVE — drag at 1×/2×/3×, plus break-even L_be = 2μ/σ² and Kelly = μ/σ², shown ONLY as
conditionals on an edge YOU enter. The script never estimates drift, and says why.
READ IT how you like: a familiar 0-100 percentile OSCILLATOR in the pane (cheap<20, expensive>80,
midline 50, like an RSI of holding-cost), or the absolute drag %/yr line. On price, a heat-RIBBON and
green/red regime triangles show cheap→expensive to hold — VOLATILITY regime, direction-agnostic. A red
marker means "expensive, size down", never "go short".
No directional claim and no backtest — there is nothing here to fit. Descriptive risk context, not advice.
Leverage magnifies losses; this shows one cost of it, not all risks.
Compound growth is g = μ − σ²/2; under leverage, g(L) = L·μ − L²·σ²/2. Return scales with L, drag scales
with L² — which is the whole reason leverage does not raise your probability of success. Volatility is
estimable in hundreds of bars; drift needs decades. So this tool measures only the knowable half:
- DRAG = σ²/2 annualised (Yang-Zhang by default; Close-to-close / Parkinson / Garman-Klass /
Rogers-Satchell selectable to see estimator disagreement = gap-risk information), EWMA-smoothed and
ranked into a percentile so you know if today is a cheap or expensive time to hold.
- DRAG DECOMPOSITION — realised drag split into its exact cumulant pieces: variance (σ²/2) + skew +
excess-kurtosis, shown as "σ² · skw · tail" in %/yr. A fat-tail warning tells you HOW MUCH of your
drag is tails, not just that they exist — and it compares realised drag to its own Gaussian part, so
it can't be fooled by estimator choice.
- LEVERAGE CURVE — drag at 1×/2×/3×, plus break-even L_be = 2μ/σ² and Kelly = μ/σ², shown ONLY as
conditionals on an edge YOU enter. The script never estimates drift, and says why.
READ IT how you like: a familiar 0-100 percentile OSCILLATOR in the pane (cheap<20, expensive>80,
midline 50, like an RSI of holding-cost), or the absolute drag %/yr line. On price, a heat-RIBBON and
green/red regime triangles show cheap→expensive to hold — VOLATILITY regime, direction-agnostic. A red
marker means "expensive, size down", never "go short".
No directional claim and no backtest — there is nothing here to fit. Descriptive risk context, not advice.
Leverage magnifies losses; this shows one cost of it, not all risks.
發行說明
minor change開源腳本
秉持TradingView一貫精神,這個腳本的創作者將其設為開源,以便交易者檢視並驗證其功能。向作者致敬!您可以免費使用此腳本,但請注意,重新發佈代碼需遵守我們的社群規範。

免責聲明
這些資訊和出版物並非旨在提供,也不構成TradingView提供或認可的任何形式的財務、投資、交易或其他類型的建議或推薦。請閱讀使用條款以了解更多資訊。
開源腳本
秉持TradingView一貫精神,這個腳本的創作者將其設為開源,以便交易者檢視並驗證其功能。向作者致敬!您可以免費使用此腳本,但請注意,重新發佈代碼需遵守我們的社群規範。
免責聲明
這些資訊和出版物並非旨在提供,也不構成TradingView提供或認可的任何形式的財務、投資、交易或其他類型的建議或推薦。請閱讀使用條款以了解更多資訊。