已更新
POC Volume Profile v2
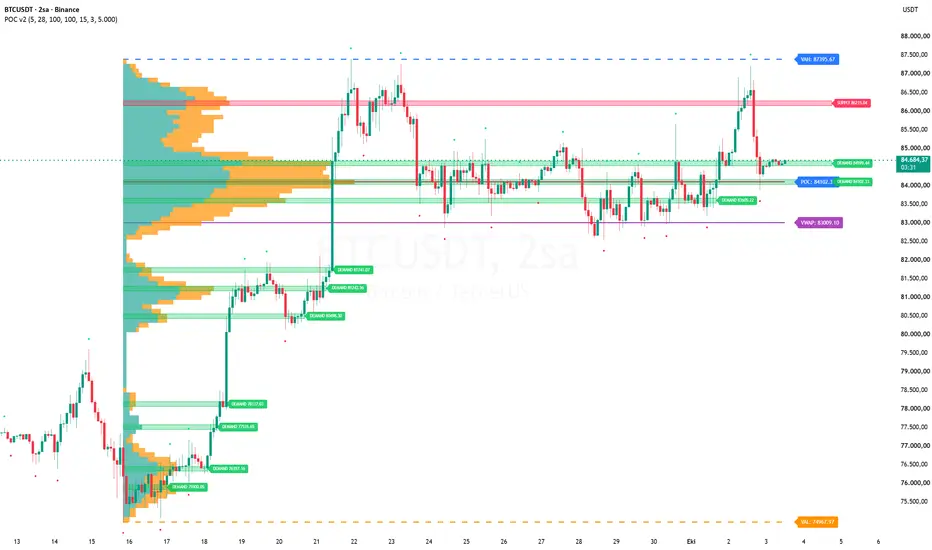
📊 POC Volume Profile v2 — What This Code Does (In Plain English)
This indicator draws a volume profile on top of your price chart. In simple terms, it shows you at which price levels the most trading happened during a chosen period.
📅 Picking a Range
Works in two ways:
Manual: You give it a start date and an end date, and it uses that period.
Automatic: It looks at swing highs and lows (called pivots) and picks a range on its own.
You can tell it which pivot to start from (e.g., the 25th most recent pivot).
If you want, it marks those pivots on the chart with green and red dots.
📊 Building the Volume Profile
It takes all the candles in the chosen range.
It splits the price range into horizontal slices (called bins).
For each candle, it spreads that candle's volume into the bins that the candle's price range covers.
This shows how much volume piled up at each price level.
If you turn on Delta mode, it also splits volume into buying (green) and selling (red) based on whether the candle closed up or down.
📌 Lines It Draws
POC (Point of Control): The price level with the most volume. Drawn as a horizontal line with a label.
VAH / VAL (Value Area High / Low): The upper and lower edges of the price band where most of the volume (usually 70%) is concentrated. Drawn as dashed lines.
VWAP: The volume-weighted average price for the whole range. Drawn as a solid line.
You can change the colors and styles of all these lines.
📈 Peak Boxes
It finds local spikes in the volume profile (called peaks).
Each peak is drawn as a horizontal box covering that price band.
If two peaks are very close together, it merges them and keeps only the strongest one.
It treats the two nearest peaks above the current price and the two nearest peaks below as "active" and extends them to the right.
Other boxes are drawn only up to the last time price touched that area.
🎯 Supply / Demand Coloring
It colors the peak boxes based on where price is:
Above price → red (SUPPLY) — potential resistance.
Below price → green (DEMAND) — potential support.
Price inside the box → gray (PRICE-IN) — neutral.
You can turn this coloring on or off, and change the colors.
🎨 Visual Stuff
Automatically detects if your chart is light or dark and adjusts text color for readability.
Can align the histogram to the right side of the chart or start it from the left.
Can highlight the POC zone with a soft fill.
Can show a summary label under the range with total volume, delta %, POC, and VWAP.
Hovering over that label shows a detailed tooltip.
⚙️ Technical Limits
Only calculates on the last bar, so it doesn't constantly redraw history.
🧠 In Short
This code is a volume map for your chart. It shows where trading activity was heaviest, where buyers and sellers concentrated, and which price levels might act as support or resistance.
This indicator draws a volume profile on top of your price chart. In simple terms, it shows you at which price levels the most trading happened during a chosen period.
📅 Picking a Range
Works in two ways:
Manual: You give it a start date and an end date, and it uses that period.
Automatic: It looks at swing highs and lows (called pivots) and picks a range on its own.
You can tell it which pivot to start from (e.g., the 25th most recent pivot).
If you want, it marks those pivots on the chart with green and red dots.
📊 Building the Volume Profile
It takes all the candles in the chosen range.
It splits the price range into horizontal slices (called bins).
For each candle, it spreads that candle's volume into the bins that the candle's price range covers.
This shows how much volume piled up at each price level.
If you turn on Delta mode, it also splits volume into buying (green) and selling (red) based on whether the candle closed up or down.
📌 Lines It Draws
POC (Point of Control): The price level with the most volume. Drawn as a horizontal line with a label.
VAH / VAL (Value Area High / Low): The upper and lower edges of the price band where most of the volume (usually 70%) is concentrated. Drawn as dashed lines.
VWAP: The volume-weighted average price for the whole range. Drawn as a solid line.
You can change the colors and styles of all these lines.
📈 Peak Boxes
It finds local spikes in the volume profile (called peaks).
Each peak is drawn as a horizontal box covering that price band.
If two peaks are very close together, it merges them and keeps only the strongest one.
It treats the two nearest peaks above the current price and the two nearest peaks below as "active" and extends them to the right.
Other boxes are drawn only up to the last time price touched that area.
🎯 Supply / Demand Coloring
It colors the peak boxes based on where price is:
Above price → red (SUPPLY) — potential resistance.
Below price → green (DEMAND) — potential support.
Price inside the box → gray (PRICE-IN) — neutral.
You can turn this coloring on or off, and change the colors.
🎨 Visual Stuff
Automatically detects if your chart is light or dark and adjusts text color for readability.
Can align the histogram to the right side of the chart or start it from the left.
Can highlight the POC zone with a soft fill.
Can show a summary label under the range with total volume, delta %, POC, and VWAP.
Hovering over that label shows a detailed tooltip.
⚙️ Technical Limits
Only calculates on the last bar, so it doesn't constantly redraw history.
🧠 In Short
This code is a volume map for your chart. It shows where trading activity was heaviest, where buyers and sellers concentrated, and which price levels might act as support or resistance.
發行說明
update
免責聲明
這些資訊和出版物並非旨在提供,也不構成TradingView提供或認可的任何形式的財務、投資、交易或其他類型的建議或推薦。請閱讀使用條款以了解更多資訊。