OPEN-SOURCE SCRIPT
已更新 Failed 2 Evaluator v2.2-Failed 2 Evaluator & Continuation Engine
Description:
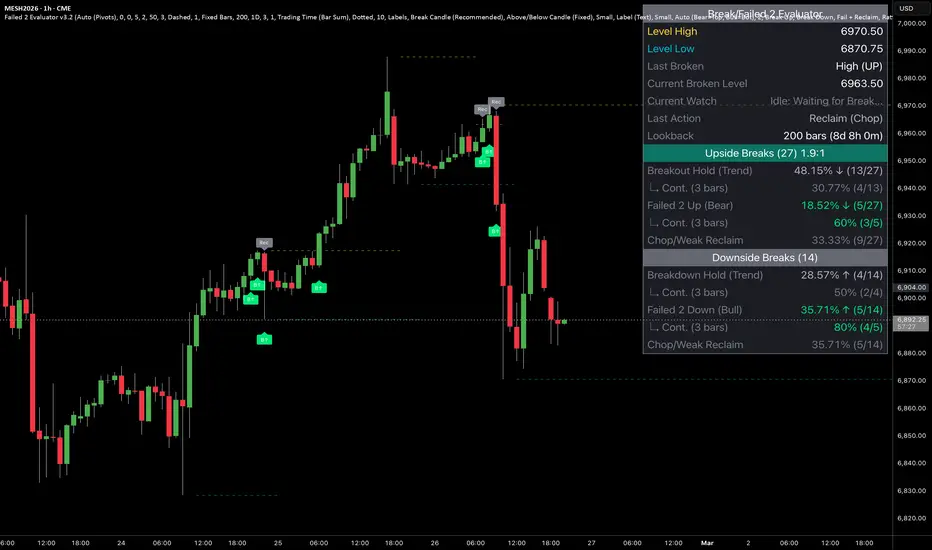
The Failed 2 Evaluator & Continuation Engine is an objective price-action analysis tool designed to categorize, visualize, and statistically track how Failed 2 candles behave when interacting with key market levels.
This indicator evaluates whether a breach of a level results in price expansion, choppy price action, or a strict structural failure (a "Failed 2" in Strat terminology), providing traders with a quantitative view of historical follow-through.
How It Is Calculated
The script operates in three distinct phases:
1. Level Generation & Trigger
The indicator establishes boundaries using either auto-calculated Pivot Highs/Lows (with user-defined left/right lengths) or manually inputted price levels. The evaluation sequence is triggered the moment a candle's total range (wick) physically breaches one of these active levels.
2. Strict Outcome Evaluation (On Close)
Once the triggering candle closes, the script strictly categorizes the outcome into one of three buckets:
Breakout/Breakdown Expansion: The candle successfully closes outside the breached level, indicating a continuation of the break.
Strict Failed 2 (F2U / F2D): The candle breaches the level but immediately reverses, failing to hold the extreme. To qualify as a true Failed 2, the script enforces a strict structural rule: the candle must close back inside the level and must be a directional reversal candle (e.g., an F2U requires the close to be below the level and below its own open).
Neutral Reclaim (Chop): The candle breaches the level and falls back inside, but fails the strict color/directional logic of a true Failed 2.
3. The Continuation Engine
When a strict Failed 2 is confirmed, the script activates a forward-looking continuation tracker. It records the closing price of the Failed 2 candle and waits a user-defined number of bars (e.g., 3 bars). It then checks if the price at that future bar successfully continued in the direction of the reversal, logging the historical frequency of structural follow-through.
Dashboard Features & Chart Visuals
Real-Time Watcher: A dynamic table row alerts the user when a live, unconfirmed candle is actively testing a level, prompting observation for either a Continuation or a Failed 2.
Historical Distribution: The dashboard calculates the exact percentage breakdown of Expansions, True Failed 2s, and Chop over a user-defined lookback window.
Chart Markers: Clean, unobtrusive visual tags pinpoint exactly where Breaks (B↑/B↓) and True Reversals (F2U/F2D) occurred on the chart for easy visual backtesting.
Analytical Purpose
The primary benefit of this tool is the removal of emotional bias and subjectivity from "false breakout" analysis. By rigidly defining what constitutes a failed move and statistically tracking its historical continuation rate, this indicator allows analysts to quantify an asset's unique behavior at range extremes. It transforms abstract price action theories into measurable, observable data.
The Failed 2 Evaluator & Continuation Engine is an objective price-action analysis tool designed to categorize, visualize, and statistically track how Failed 2 candles behave when interacting with key market levels.
This indicator evaluates whether a breach of a level results in price expansion, choppy price action, or a strict structural failure (a "Failed 2" in Strat terminology), providing traders with a quantitative view of historical follow-through.
How It Is Calculated
The script operates in three distinct phases:
1. Level Generation & Trigger
The indicator establishes boundaries using either auto-calculated Pivot Highs/Lows (with user-defined left/right lengths) or manually inputted price levels. The evaluation sequence is triggered the moment a candle's total range (wick) physically breaches one of these active levels.
2. Strict Outcome Evaluation (On Close)
Once the triggering candle closes, the script strictly categorizes the outcome into one of three buckets:
Breakout/Breakdown Expansion: The candle successfully closes outside the breached level, indicating a continuation of the break.
Strict Failed 2 (F2U / F2D): The candle breaches the level but immediately reverses, failing to hold the extreme. To qualify as a true Failed 2, the script enforces a strict structural rule: the candle must close back inside the level and must be a directional reversal candle (e.g., an F2U requires the close to be below the level and below its own open).
Neutral Reclaim (Chop): The candle breaches the level and falls back inside, but fails the strict color/directional logic of a true Failed 2.
3. The Continuation Engine
When a strict Failed 2 is confirmed, the script activates a forward-looking continuation tracker. It records the closing price of the Failed 2 candle and waits a user-defined number of bars (e.g., 3 bars). It then checks if the price at that future bar successfully continued in the direction of the reversal, logging the historical frequency of structural follow-through.
Dashboard Features & Chart Visuals
Real-Time Watcher: A dynamic table row alerts the user when a live, unconfirmed candle is actively testing a level, prompting observation for either a Continuation or a Failed 2.
Historical Distribution: The dashboard calculates the exact percentage breakdown of Expansions, True Failed 2s, and Chop over a user-defined lookback window.
Chart Markers: Clean, unobtrusive visual tags pinpoint exactly where Breaks (B↑/B↓) and True Reversals (F2U/F2D) occurred on the chart for easy visual backtesting.
Analytical Purpose
The primary benefit of this tool is the removal of emotional bias and subjectivity from "false breakout" analysis. By rigidly defining what constitutes a failed move and statistically tracking its historical continuation rate, this indicator allows analysts to quantify an asset's unique behavior at range extremes. It transforms abstract price action theories into measurable, observable data.
發行說明
Release Notes: v2.3 - Directional Bias & Continuation EngineThis major update expands the statistical capabilities of the Failed 2 Evaluator, transforming it into a "Level Interaction" diagnostic tool.
New Features:
Split Directional Statistics: The dashboard now separates "Upside Interactions" (Resistance tests) from "Downside Interactions" (Support tests). This allows traders to immediately identify directional pressure and bias (e.g., "Testing highs 19 times vs lows 5 times").
Breakout Continuation Tracking: Added a new logic engine that tracks the success rate of **Breakout Holds**. The script now calculates the probability of a breakout continuing in the trend direction after *N* bars (user-defined), enabling a direct comparison between "Trend Continuation" vs. "Reversal Failure" probabilities.
"Chop" Transparency: The table now explicitly lists "Chop/Weak Reclaims" (interactions that failed to hold but didn't meet strict reversal criteria). This ensures 100% of level interactions are accounted for, providing a true denominator for probability calculations.
Customizable Data Colors: Added a "Table Data Colors" settings group. Users can now customize the text colors for Breakouts, Chop, and Neutral statistics to ensure visibility on both Light and Dark themes.
Enhanced Trend Visuals: Trend dots (🟢/🔴) have been expanded to track momentum for both Breakouts and Reclaims independently on both sides of the market.
Optimizations:
Refined the "Total Interaction" math to ensure strict separation between "Hold," "Strict Reclaim," and "Chop."
Fixed a visibility issue where "Chop" stats were hard to read on dark backgrounds by defaulting to a brighter silver (now fully customizable).
發行說明
Version 2.5 updateThis update allows the user to choose a time frame (30-min and up) for the look-back period, in addition to the number of bars. If you desire to look back on a smaller lookback period (under 30 minutes) you are required to specify the number of bars to look back.
I also included an option to hide certain markers to clean up the chart. Hiding the markers does not affect the math or values displayed on the table. Finally, the alerts are customizable allowing you to alert you for either breaks of levels and/or failed two up/failed two down conditions.
發行說明
v2.6 Fixed Label Placement so the user can make it automatic above/below the candle depending on direction. Also placed a ratio of Break Ups/Break Downs, which will print on the prevailing part of the ratio.發行說明
v2.7 Added a highlight option for the user to quickly ID which side is breaking more often in the chosen lookback period.發行說明
v3.0 I tweaked the Strat Failed 2U/D definition because I spotted a tiny error that was bugging me.發行說明
v3.2 User can now limit the number of lablels are shown making for a cleaner chart. 開源腳本
秉持TradingView一貫精神,這個腳本的創作者將其設為開源,以便交易者檢視並驗證其功能。向作者致敬!您可以免費使用此腳本,但請注意,重新發佈代碼需遵守我們的社群規範。

免責聲明
這些資訊和出版物並非旨在提供,也不構成TradingView提供或認可的任何形式的財務、投資、交易或其他類型的建議或推薦。請閱讀使用條款以了解更多資訊。
開源腳本
秉持TradingView一貫精神,這個腳本的創作者將其設為開源,以便交易者檢視並驗證其功能。向作者致敬!您可以免費使用此腳本,但請注意,重新發佈代碼需遵守我們的社群規範。
免責聲明
這些資訊和出版物並非旨在提供,也不構成TradingView提供或認可的任何形式的財務、投資、交易或其他類型的建議或推薦。請閱讀使用條款以了解更多資訊。