已更新
Relative Volume Strength Index
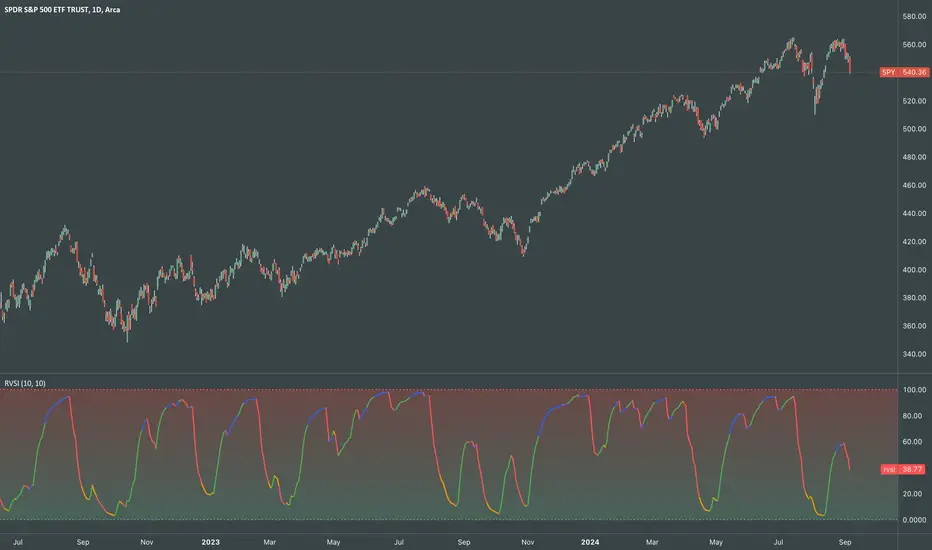
RVSI is an alternative volume-based indicator that measures the rate of change of average OBV.
How to read a chart using it?
It looks simple, but it's powerful!
I'd use RVSI in combination with price-based indicators.
How to read a chart using it?
- First signal to buy is when you see RVSI is close to green oversold levels.
- Once RVSI passes above it's orange EMA, that would be the second alert of accumulation.
- Be always cautious when it reaches 50 level as a random statistical correction can be expected because of "market noises".
- You know it's a serious uptrend when it reaches above 75 and fluctuates there, grading behind EMA.
- The best signal to sell would be a situation where you see RVSI passing below it's EMA when the whole thing is close to Red overbought level
It looks simple, but it's powerful!
I'd use RVSI in combination with price-based indicators.
發行說明
Update:Added visual intuitiveness
發行說明
upd發行說明
Effective increase in responsiveness due to a slight change in formula.發行說明
- Color-coded rate of change relative to its linear regression
- Changed formula to enhance the responsiveness

免責聲明
這些資訊和出版物並非旨在提供,也不構成TradingView提供或認可的任何形式的財務、投資、交易或其他類型的建議或推薦。請閱讀使用條款以了解更多資訊。