已更新
ATH/ATL Fibonacci Retracement - Labels, Golden Pocket & Alerts
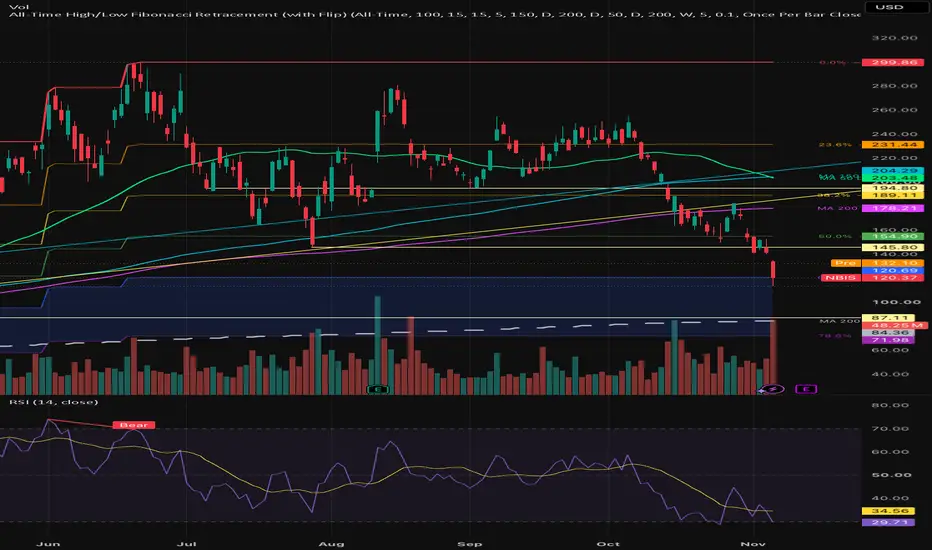
Plots Fibonacci retracement levels anchored to the all-time high and all-time low of the loaded chart history. The range updates automatically as new highs or lows print, so the levels always reflect the full extent of price action without manual redrawing.
Features:
- Auto ATH/ATL tracking — the 0% and 100% anchors update dynamically across all available history.
- Flip toggle — switch 0% between the top (all-time high) and the bottom (all-time low) to suit your bias or the direction of the move you're measuring.
- Standard Fib levels — 0%, 23.6%, 38.2%, 50%, 61.8%, 78.6%, and 100%, each color-coded.
- On-chart labels — every level shows its retracement percentage alongside the exact price, placed to the right of the last bar. Adjustable offset.
- Golden pocket shading — the 61.8%–78.6% reaction zone is highlighted for quick visual reference. Toggle on/off.
- Built-in alerts — alert conditions on crosses of each major level, plus a golden-pocket entry alert, ready to wire up from the Create Alert dialog.
Notes: Levels are based on the chart's loaded history, so the all-time high/low depends on how far back your data goes and your timeframe. This is an analysis tool, not financial advice — use it alongside your own process and risk management.
Features:
- Auto ATH/ATL tracking — the 0% and 100% anchors update dynamically across all available history.
- Flip toggle — switch 0% between the top (all-time high) and the bottom (all-time low) to suit your bias or the direction of the move you're measuring.
- Standard Fib levels — 0%, 23.6%, 38.2%, 50%, 61.8%, 78.6%, and 100%, each color-coded.
- On-chart labels — every level shows its retracement percentage alongside the exact price, placed to the right of the last bar. Adjustable offset.
- Golden pocket shading — the 61.8%–78.6% reaction zone is highlighted for quick visual reference. Toggle on/off.
- Built-in alerts — alert conditions on crosses of each major level, plus a golden-pocket entry alert, ready to wire up from the Create Alert dialog.
Notes: Levels are based on the chart's loaded history, so the all-time high/low depends on how far back your data goes and your timeframe. This is an analysis tool, not financial advice — use it alongside your own process and risk management.
發行說明
What changed:The new use_local toggle is your button. When off, the script behaves exactly as before (all-time high/low). When on, it swaps the range anchors to ta.highest(high, lookback) and ta.lowest(low, lookback) — the highest high and lowest low over the last N bars.
I did this by introducing two selector variables, hi and lo, and pointing all the Fib math at them instead of directly at ath/atl. That keeps the flip logic, labels, golden pocket, and alerts untouched — they all just read whatever range is currently active.
The lookback input (default 100 bars) controls how "local" the swing is. Drop it to something like 20–50 for tighter intraday swings, or raise it for broader ones. Note it's a fixed bar-count window, not an automatic swing-point detector — so the local high/low is simply the extreme within that trailing window, which will shift as the window slides.
One thing worth flagging: I removed the "Enter Golden Pocket" compound alert we discussed earlier, since it was the fragile one and you didn't confirm wanting the zone-occupancy version. If you want a reliable pocket-entry alert now that local mode makes the pocket more actionable, I'd add close crossing into math.min/math.max(fib_618, fib_786) — say the word.
Also, since the range is now dynamic in local mode, you might update the published title/description to mention the local/swing option. Want me to revise those?
發行說明
WHAT'S NEWAdded: Moving Averages
- Two configurable moving averages (default 150 & 200).
- Independent timeframe control per MA — choose Daily, Weekly, or Monthly for each one separately (e.g. a weekly 150 alongside a monthly 200).
- Full color picker for each MA line.
- Adjustable length for each MA.
- Master show/hide toggle for both MAs at once.
- MAs are pulled from their selected timeframe via higher-timeframe data, so they stay true to that timeframe even when viewed on a lower chart timeframe.
Note: Higher-timeframe MAs require proportionally more history to populate — a monthly 200 SMA needs roughly 17 years of data before it fully renders.
發行說明
Added MA 3 and MA 4 with timeframe selection, per-MA toggles, value labels with stacking.發行說明
Updating chart image發行說明
Moving averagesAdded MA 3 and MA 4, so there are now four moving averages.
Each MA has its own on/off checkbox, length, timeframe (Daily / Weekly / Monthly) and color.
Each MA is calculated on its own selected timeframe, so it stays accurate when viewed on a lower chart timeframe.
The “Show Moving Averages” master switch hides all four at once.
MA labels
A label to the right of each MA shows its length, timeframe and current value, e.g. MA 150 D (64231.50).
“Right Padding (bars)” sets how far from the last bar the labels sit.
Labels stack automatically so they don’t overlap. “Min Spacing (× ATR)” controls the gap.
A label hides when its MA is turned off.
MA cross alerts
Under each MA: alert checkboxes for ⇅ Cross (either direction), ↗ Cross Up and ↘ Cross Down.
One alert covers everything: tick the boxes you want, then create an alert with the condition “Any alert() function call”.
Alert messages name the MA, its timeframe, the direction and the price, e.g. BTCUSD: price crossed ↗ ABOVE MA 150 D (64231.50) — close 64300.00.
“MA Alert Frequency”: Once Per Bar Close (default, avoids crosses that reverse before the close) or Once Per Bar.
Individual conditions “MA 1–4: Cross Above / Cross Below” are also available in the alert condition list.
Note: existing alerts keep the settings from when they were created. After updating, or after changing any alert checkbox, delete and re-create your alerts.
發行說明
Moving averagesAdded MA 3 and MA 4, so there are now four moving averages.
Each MA has its own on/off checkbox, length, timeframe (Daily / Weekly / Monthly) and color.
Each MA is calculated on its own selected timeframe, so it stays accurate when viewed on a lower chart timeframe.
The “Show Moving Averages” master switch hides all four at once.
MA labels
A label to the right of each MA shows its length, timeframe and current value, e.g. MA 150 D (64231.50).
“Right Padding (bars)” sets how far from the last bar the labels sit.
Labels stack automatically so they don’t overlap. “Min Spacing (× ATR)” controls the gap.
A label hides when its MA is turned off.
MA cross alerts
Under each MA: alert checkboxes for ⇅ Cross (either direction), ↗ Cross Up and ↘ Cross Down.
One alert covers everything: tick the boxes you want, then create an alert with the condition “Any alert() function call”.
Alert messages name the MA, its timeframe, the direction and the price, e.g. BTCUSD: price crossed ↗ ABOVE MA 150 D (64231.50) — close 64300.00.
“MA Alert Frequency”: Once Per Bar Close (default, avoids crosses that reverse before the close) or Once Per Bar.
Individual conditions “MA 1–4: Cross Above / Cross Below” are also available in the alert condition list.
Note: existing alerts keep the settings from when they were created. After updating, or after changing any alert checkbox, delete and re-create your alerts.

免責聲明
這些資訊和出版物並非旨在提供,也不構成TradingView提供或認可的任何形式的財務、投資、交易或其他類型的建議或推薦。請閱讀使用條款以了解更多資訊。