OPEN-SOURCE SCRIPT
Day-of-Week Effect
What the script does
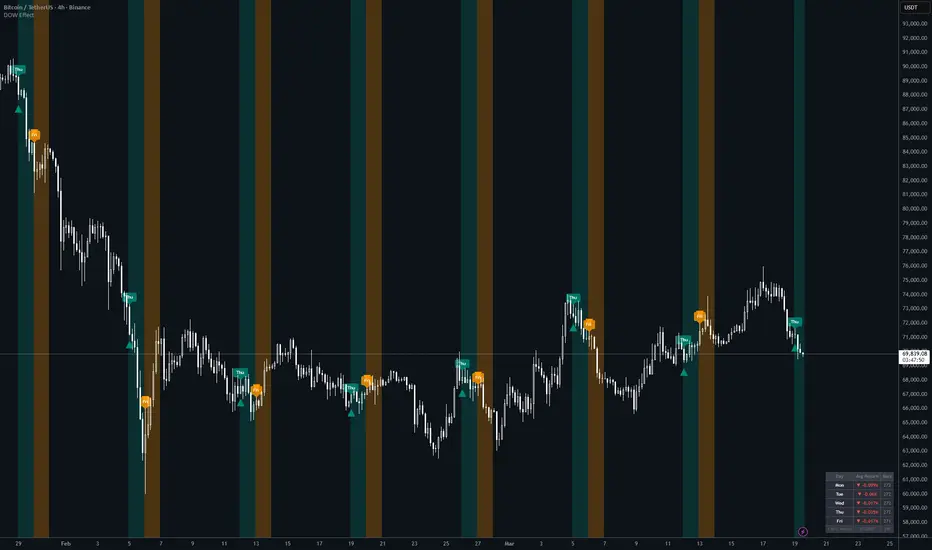
The Day-of-Week Effect indicator visualises a well-known market anomaly: certain days of the week produce statistically different average returns. The script identifies your chosen entry and exit days on any chart, highlights them visually, and calculates the historical average close-to-close return for every weekday — so you can see at a glance whether the effect actually holds on your chosen instrument.
How it works
On each bar, the script reads the day of the week using Pine Script's built-in dayofweek variable. It detects the first bar of each new trading day using ta.change(time("D")), which prevents signals from firing on every intraday bar if you're on a sub-daily timeframe. It then accumulates a running sum and count of close-to-close returns per weekday across the entire chart history, dividing them at the last bar to produce the average return table.
How to use it
Open TradingView, paste the script into the Pine Editor and click "Add to chart." The indicator works best on the 1D timeframe. In the Settings panel, toggle which days you want highlighted as entry days (teal) and exit days (orange)
Why it's original
Most DOW indicators simply colour-code days. This one goes further by pairing the visual highlighting with a live per-weekday return breakdown calculated directly from your chart's own price history — so rather than applying a generic market assumption, you're validating the effect on your specific ticker and timeframe before acting on it.
Alerts
The script does not currently include alertcondition() calls. To add alerts, you can extend the script with:
Pine Script®
The Day-of-Week Effect indicator visualises a well-known market anomaly: certain days of the week produce statistically different average returns. The script identifies your chosen entry and exit days on any chart, highlights them visually, and calculates the historical average close-to-close return for every weekday — so you can see at a glance whether the effect actually holds on your chosen instrument.
How it works
On each bar, the script reads the day of the week using Pine Script's built-in dayofweek variable. It detects the first bar of each new trading day using ta.change(time("D")), which prevents signals from firing on every intraday bar if you're on a sub-daily timeframe. It then accumulates a running sum and count of close-to-close returns per weekday across the entire chart history, dividing them at the last bar to produce the average return table.
How to use it
Open TradingView, paste the script into the Pine Editor and click "Add to chart." The indicator works best on the 1D timeframe. In the Settings panel, toggle which days you want highlighted as entry days (teal) and exit days (orange)
- Use the stats table in the bottom-right to identify which days have historically been strongest on your instrument
- Tthen configure your entry/exit days accordingly
- The display settings let you turn off labels, background shading, or the table independently
Why it's original
Most DOW indicators simply colour-code days. This one goes further by pairing the visual highlighting with a live per-weekday return breakdown calculated directly from your chart's own price history — so rather than applying a generic market assumption, you're validating the effect on your specific ticker and timeframe before acting on it.
Alerts
The script does not currently include alertcondition() calls. To add alerts, you can extend the script with:
開源腳本
秉持TradingView一貫精神,這個腳本的創作者將其設為開源,以便交易者檢視並驗證其功能。向作者致敬!您可以免費使用此腳本,但請注意,重新發佈代碼需遵守我們的社群規範。

免責聲明
這些資訊和出版物並非旨在提供,也不構成TradingView提供或認可的任何形式的財務、投資、交易或其他類型的建議或推薦。請閱讀使用條款以了解更多資訊。
開源腳本
秉持TradingView一貫精神,這個腳本的創作者將其設為開源,以便交易者檢視並驗證其功能。向作者致敬!您可以免費使用此腳本,但請注意,重新發佈代碼需遵守我們的社群規範。
免責聲明
這些資訊和出版物並非旨在提供,也不構成TradingView提供或認可的任何形式的財務、投資、交易或其他類型的建議或推薦。請閱讀使用條款以了解更多資訊。