Higher Time Frame Market Structure Dashboard
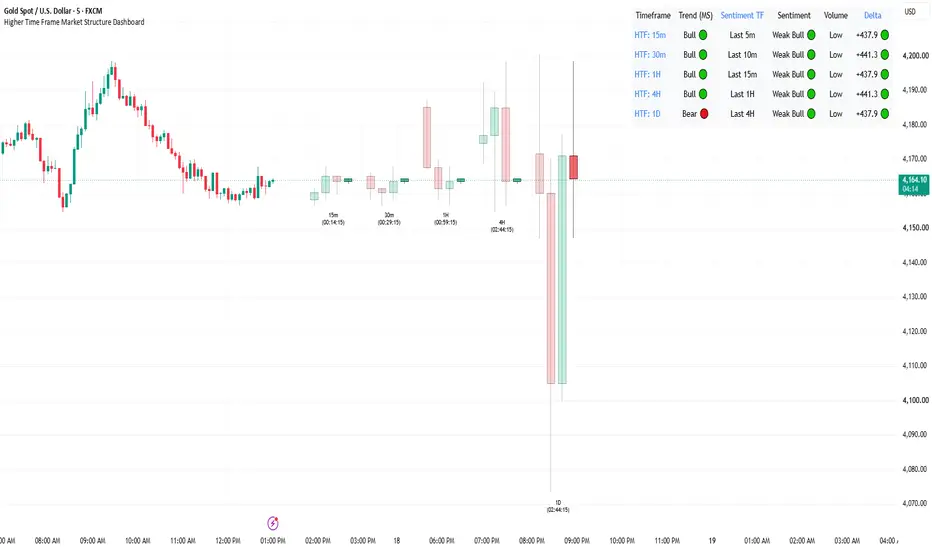
Higher Time Frame Market Structure Dashboard
Overview
Higher Time Frame Market Structure Dashboard is a multi-timeframe indicator designed to help traders analyze market structure, candle sentiment, and volume conditions from a single chart.
The indicator projects selected higher-timeframe candles onto the active chart and displays a dashboard containing structural trend information, candle strength, relative volume, and estimated volume delta.
Its purpose is to make multi-timeframe analysis more convenient without requiring traders to switch repeatedly between chart timeframes.
Key Features
How It Works
The indicator retrieves data from selected timeframes and uses chart drawings to display historical higher-timeframe candles alongside an analytical dashboard.
Market structure is classified using pivot highs and lows and the relative timing of closing-price breaks. This is a simplified directional classification rather than a complete Smart Money Concepts structure-mapping system.
Candle sentiment is based on the proportion of the candle's total range represented by its body. Relative volume is evaluated against a moving average, while the estimated delta calculation distributes volume according to the closing price's position within the candle range.
The dashboard combines these readings to help traders compare conditions across timeframes.
How to Use
1. Add the indicator to your TradingView chart.
2. Open the indicator settings and enable the timeframe slots you want to monitor.
3. Select the timeframes appropriate for your analysis.
4. Adjust the historical candle count, spacing, colors, and dashboard appearance to suit your chart.
5. Compare market structure across the selected timeframes.
6. Review candle sentiment and relative volume together to assess the current candle's characteristics.
7. Use estimated delta and its divergence flag as additional context rather than standalone trading signals.
For conventional higher-timeframe analysis, select timeframes above your active chart timeframe.
Understanding the Readings
Market Structure: The directional classification is based on confirmed pivot levels and closing-price breaks. Pivot confirmation requires subsequent bars, so changes in classification may lag price action.
Candle Sentiment: A candle is classified as strong when its body represents at least 60% of its total high-to-low range. Otherwise, it is classified as weak.
Relative Volume: Volume is compared with a 20-period simple moving average. The highest-volume category is triggered when volume exceeds twice the average.
Estimated Delta: The indicator estimates buying and selling pressure from OHLCV candle data. This is not actual bid/ask volume delta or exchange-level footprint data.
Divergence: The dashboard flags selected conflicts between estimated delta and candle sentiment. Such conflicts do not independently confirm absorption, institutional activity, or a price reversal.
Limitations
Important Notes
Test the indicator on your intended symbols and timeframes before using its readings in a trading plan. Check the behavior of open higher-timeframe candles and ensure that projected candles and dashboard elements remain readable on your chart.
This indicator is an analytical tool intended to support independent market analysis and risk management.
Overview
Higher Time Frame Market Structure Dashboard is a multi-timeframe indicator designed to help traders analyze market structure, candle sentiment, and volume conditions from a single chart.
The indicator projects selected higher-timeframe candles onto the active chart and displays a dashboard containing structural trend information, candle strength, relative volume, and estimated volume delta.
Its purpose is to make multi-timeframe analysis more convenient without requiring traders to switch repeatedly between chart timeframes.
Key Features
- Multi-Timeframe Analysis: Monitor up to six configurable timeframe slots.
- Higher-Timeframe Candle Projection: Display historical higher-timeframe candles directly on your active chart.
- Market Structure: Classify directional structure using confirmed pivot highs, pivot lows, and closing-price breaks.
- Candle Sentiment: Categorize candles as strong or weak according to their body size relative to their full range.
- Relative Volume: Compare current volume with its moving average to identify changes in relative activity.
- Estimated Volume Delta: Display an OHLCV-based estimate of buying and selling pressure.
- Delta Divergence Flag: Highlight selected conflicts between estimated delta direction and candle sentiment.
- Countdown Timer: Display the remaining time until the relevant higher-timeframe candle closes.
- Customizable Display: Adjust timeframe visibility, historical candle count, candle spacing, colors, dashboard position, and text size.
How It Works
The indicator retrieves data from selected timeframes and uses chart drawings to display historical higher-timeframe candles alongside an analytical dashboard.
Market structure is classified using pivot highs and lows and the relative timing of closing-price breaks. This is a simplified directional classification rather than a complete Smart Money Concepts structure-mapping system.
Candle sentiment is based on the proportion of the candle's total range represented by its body. Relative volume is evaluated against a moving average, while the estimated delta calculation distributes volume according to the closing price's position within the candle range.
The dashboard combines these readings to help traders compare conditions across timeframes.
How to Use
1. Add the indicator to your TradingView chart.
2. Open the indicator settings and enable the timeframe slots you want to monitor.
3. Select the timeframes appropriate for your analysis.
4. Adjust the historical candle count, spacing, colors, and dashboard appearance to suit your chart.
5. Compare market structure across the selected timeframes.
6. Review candle sentiment and relative volume together to assess the current candle's characteristics.
7. Use estimated delta and its divergence flag as additional context rather than standalone trading signals.
For conventional higher-timeframe analysis, select timeframes above your active chart timeframe.
Understanding the Readings
Market Structure: The directional classification is based on confirmed pivot levels and closing-price breaks. Pivot confirmation requires subsequent bars, so changes in classification may lag price action.
Candle Sentiment: A candle is classified as strong when its body represents at least 60% of its total high-to-low range. Otherwise, it is classified as weak.
Relative Volume: Volume is compared with a 20-period simple moving average. The highest-volume category is triggered when volume exceeds twice the average.
Estimated Delta: The indicator estimates buying and selling pressure from OHLCV candle data. This is not actual bid/ask volume delta or exchange-level footprint data.
Divergence: The dashboard flags selected conflicts between estimated delta and candle sentiment. Such conflicts do not independently confirm absorption, institutional activity, or a price reversal.
Limitations
- Market structure is a simplified trend classification and does not explicitly map every Break of Structure (BOS) or Change of Character (CHoCH).
- Pivot-based calculations can produce delayed structural changes.
- Estimated delta is a proxy derived from candle data, not actual trade-by-trade order flow.
- Candle sentiment and relative-volume classifications are simplified measurements, not a complete Volume Spread Analysis methodology.
- Values associated with an open candle may change before that candle closes.
- Data availability and results may vary across symbols, markets, and timeframes.
- The indicator does not guarantee market direction or trading performance.
Important Notes
Test the indicator on your intended symbols and timeframes before using its readings in a trading plan. Check the behavior of open higher-timeframe candles and ensure that projected candles and dashboard elements remain readable on your chart.
This indicator is an analytical tool intended to support independent market analysis and risk management.

TradingAnalysis.ai — Analyze Better, Trade Smarter.
Market outlooks, key levels & actionable scenarios for traders.
🔗 tradinganalysis.ai
Market outlooks, key levels & actionable scenarios for traders.
🔗 tradinganalysis.ai
免責聲明
這些資訊和出版物並非旨在提供,也不構成TradingView提供或認可的任何形式的財務、投資、交易或其他類型的建議或推薦。請閱讀使用條款以了解更多資訊。
TradingAnalysis.ai — Analyze Better, Trade Smarter.
Market outlooks, key levels & actionable scenarios for traders.
🔗 tradinganalysis.ai
Market outlooks, key levels & actionable scenarios for traders.
🔗 tradinganalysis.ai
免責聲明
這些資訊和出版物並非旨在提供,也不構成TradingView提供或認可的任何形式的財務、投資、交易或其他類型的建議或推薦。請閱讀使用條款以了解更多資訊。