OPEN-SOURCE SCRIPT
Time of Day Levels
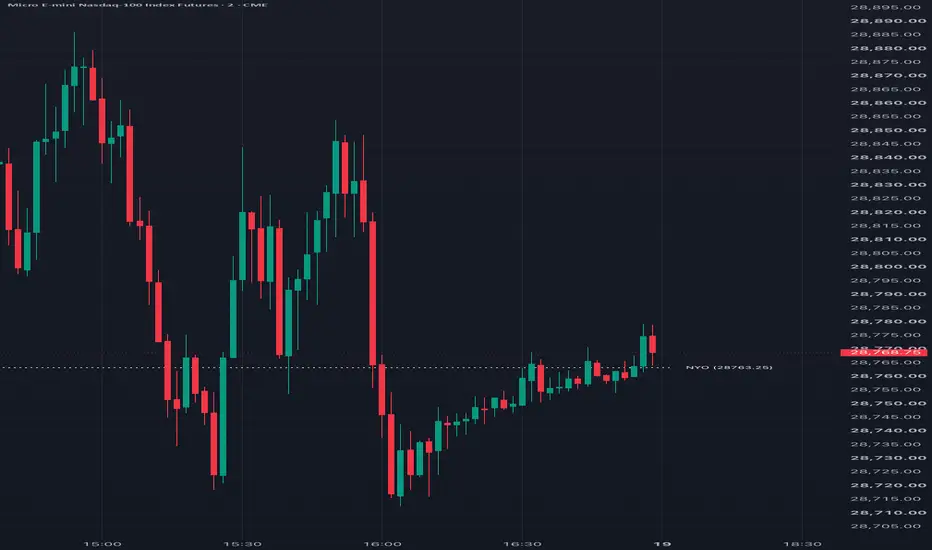
This is an indicator to plot a level that corresponds to a particular time of day (hour and minute) and draw that level as a horizontal line, with text tag, as far through the rest of the day as desired. It is common to plot midnight open and cash market open as levels, but this will give you the ability to plot for other times as well, useful for some trading strategies.
The historically difficult thing to do has been plotting for times that fall in the middle of a time bar, like if you wanted to plot the level for 9:53 on a 5 minute chart. When the level does not correspond to beginning or end of a chart's bar, the code will look back up to 15 minutes into the middle of the bar to find the level. So, it will work will for time bars up to 15 minutes, but may not show the level for larger time bars.
Note: This has not been tested for charts that don't use fixed time bars
For up to 10 time levels, you can specify the following:
For the text tags, you can specify the following:
In Other Settings, you can also force the times to be interpreted as Eastern Standard Time, accounting for daylight savings. Otherwise, local chart time will be used
The historically difficult thing to do has been plotting for times that fall in the middle of a time bar, like if you wanted to plot the level for 9:53 on a 5 minute chart. When the level does not correspond to beginning or end of a chart's bar, the code will look back up to 15 minutes into the middle of the bar to find the level. So, it will work will for time bars up to 15 minutes, but may not show the level for larger time bars.
Note: This has not been tested for charts that don't use fixed time bars
For up to 10 time levels, you can specify the following:
- Hour: An integer specifying the desired hour in 24 hour format
- Minute: An integer specifying the desired minute in that hour
- Use Close: If checked will spot the closing value of the specified 1 minute time, otherwise will show the opening value
- Tag Text: Text to show to the right of the horizontal line plots for the time level
- Extend Minutes: How long, in minutes, to extend the line from the specified time. If set to 0 or 1440, the line will just always be updated to the current day
- Color - Style - Width: Specifies the style for the plotted horizontal line
For the text tags, you can specify the following:
- Color: The color for all text tags, unless choosing to use the individual line colors
- Size: Size of text tags
- Offset: The number of bars to the right of the plotted horizontal line before showing the text tag. A value of 0 will place it right next to the horizontal line
- Use Line Color: Instead of using the Text Tag Color, text tags will be drawn in the same color as the horizontal line
- Show Level: When checked, the price level will be printed to the right of the text tag in parentheses
In Other Settings, you can also force the times to be interpreted as Eastern Standard Time, accounting for daylight savings. Otherwise, local chart time will be used
開源腳本
秉持TradingView一貫精神,這個腳本的創作者將其設為開源,以便交易者檢視並驗證其功能。向作者致敬!您可以免費使用此腳本,但請注意,重新發佈代碼需遵守我們的社群規範。

免責聲明
這些資訊和出版物並非旨在提供,也不構成TradingView提供或認可的任何形式的財務、投資、交易或其他類型的建議或推薦。請閱讀使用條款以了解更多資訊。
開源腳本
秉持TradingView一貫精神,這個腳本的創作者將其設為開源,以便交易者檢視並驗證其功能。向作者致敬!您可以免費使用此腳本,但請注意,重新發佈代碼需遵守我們的社群規範。
免責聲明
這些資訊和出版物並非旨在提供,也不構成TradingView提供或認可的任何形式的財務、投資、交易或其他類型的建議或推薦。請閱讀使用條款以了解更多資訊。