OPEN-SOURCE SCRIPT
Intraday Bias Engine
Intraday Bias Engine
OVERVIEW
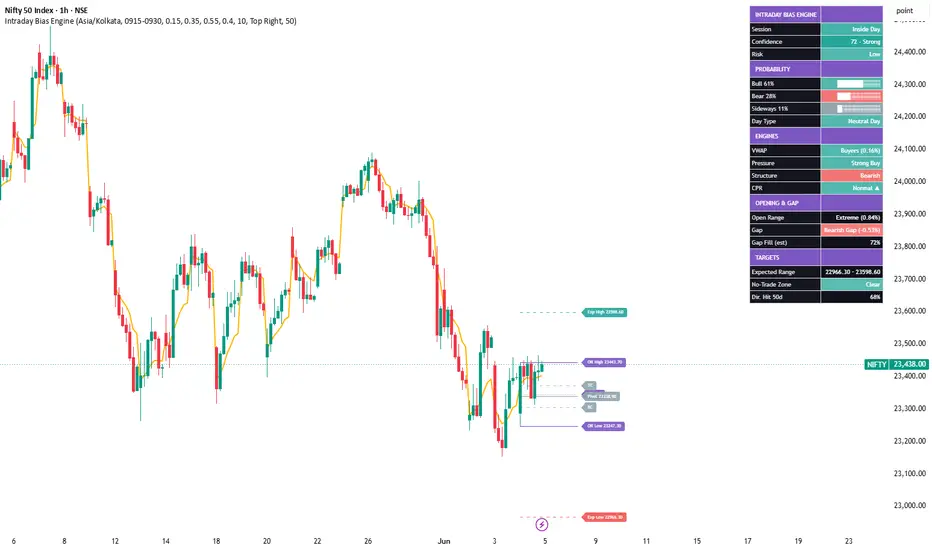
A probability-based intraday decision dashboard. After the opening auction it
estimates the highest-probability scenario for the session (bullish, bearish or
sideways), the likely day-type, an expected range and a confidence grade - by
combining several classic intraday models into one read. It is a context and
decision-support tool, not a buy/sell signal generator.
WHAT IT COMBINES
- Opening Range: high/low/mid, width vs the day's ATR, classified Narrow / Normal
/ Wide / Extreme.
- Gap: size and direction vs the previous close, with a transparent gap-fill
estimate (smaller gaps tend to fill more often).
- CPR: pivot, TC, BC, width classification and directional bias.
- VWAP: position, distance and who is in control.
- Market structure: higher-high / higher-low vs lower-high / lower-low.
- Smart-money pressure: a 0-100 score from a volume-delta approximation, relative
volume, range expansion, momentum and VWAP distance.
- Directional probability: a weighted blend of the above, normalised so Bull,
Bear and Sideways always total 100%.
- Day-type, expected range, confidence grade and a basic risk read.
DASHBOARD
A movable panel shows session classification, confidence and grade, Bull/Bear/
Sideways probability meters, the individual engine reads, opening-range and gap
context, the expected range, a no-trade (compression) status and a simple
directional hit-rate over the recent sessions.
ON-CHART
Opening Range, CPR (P/TC/BC), VWAP and expected-range bands are drawn for the
current day only. Compression conditions are highlighted as a faint no-trade zone.
HOW TO USE
1. Use an intraday timeframe on a symbol with reliable volume.
2. The read finalises after the opening-range window closes.
3. Favour setups that agree with the dominant probability and a higher confidence
grade; stand aside when the no-trade zone is active.
4. Treat the levels and probabilities as context for your own plan and risk
management.
NOTES
- Daily anchors use confirmed prior sessions; current-day levels draw forward
only and do not repaint historical bars. The live read updates as the day
develops, which is expected for an intraday model.
- The gap-fill figure and the directional hit-rate are simple estimates, not
performance guarantees.
- This script is for research and education only and is not financial advice.
OVERVIEW
A probability-based intraday decision dashboard. After the opening auction it
estimates the highest-probability scenario for the session (bullish, bearish or
sideways), the likely day-type, an expected range and a confidence grade - by
combining several classic intraday models into one read. It is a context and
decision-support tool, not a buy/sell signal generator.
WHAT IT COMBINES
- Opening Range: high/low/mid, width vs the day's ATR, classified Narrow / Normal
/ Wide / Extreme.
- Gap: size and direction vs the previous close, with a transparent gap-fill
estimate (smaller gaps tend to fill more often).
- CPR: pivot, TC, BC, width classification and directional bias.
- VWAP: position, distance and who is in control.
- Market structure: higher-high / higher-low vs lower-high / lower-low.
- Smart-money pressure: a 0-100 score from a volume-delta approximation, relative
volume, range expansion, momentum and VWAP distance.
- Directional probability: a weighted blend of the above, normalised so Bull,
Bear and Sideways always total 100%.
- Day-type, expected range, confidence grade and a basic risk read.
DASHBOARD
A movable panel shows session classification, confidence and grade, Bull/Bear/
Sideways probability meters, the individual engine reads, opening-range and gap
context, the expected range, a no-trade (compression) status and a simple
directional hit-rate over the recent sessions.
ON-CHART
Opening Range, CPR (P/TC/BC), VWAP and expected-range bands are drawn for the
current day only. Compression conditions are highlighted as a faint no-trade zone.
HOW TO USE
1. Use an intraday timeframe on a symbol with reliable volume.
2. The read finalises after the opening-range window closes.
3. Favour setups that agree with the dominant probability and a higher confidence
grade; stand aside when the no-trade zone is active.
4. Treat the levels and probabilities as context for your own plan and risk
management.
NOTES
- Daily anchors use confirmed prior sessions; current-day levels draw forward
only and do not repaint historical bars. The live read updates as the day
develops, which is expected for an intraday model.
- The gap-fill figure and the directional hit-rate are simple estimates, not
performance guarantees.
- This script is for research and education only and is not financial advice.
開源腳本
秉持TradingView一貫精神,這個腳本的創作者將其設為開源,以便交易者檢視並驗證其功能。向作者致敬!您可以免費使用此腳本,但請注意,重新發佈代碼需遵守我們的社群規範。

免責聲明
這些資訊和出版物並非旨在提供,也不構成TradingView提供或認可的任何形式的財務、投資、交易或其他類型的建議或推薦。請閱讀使用條款以了解更多資訊。
開源腳本
秉持TradingView一貫精神,這個腳本的創作者將其設為開源,以便交易者檢視並驗證其功能。向作者致敬!您可以免費使用此腳本,但請注意,重新發佈代碼需遵守我們的社群規範。
免責聲明
這些資訊和出版物並非旨在提供,也不構成TradingView提供或認可的任何形式的財務、投資、交易或其他類型的建議或推薦。請閱讀使用條款以了解更多資訊。