OPEN-SOURCE SCRIPT
Order Flow Delta Proxy (Tick-Rule)
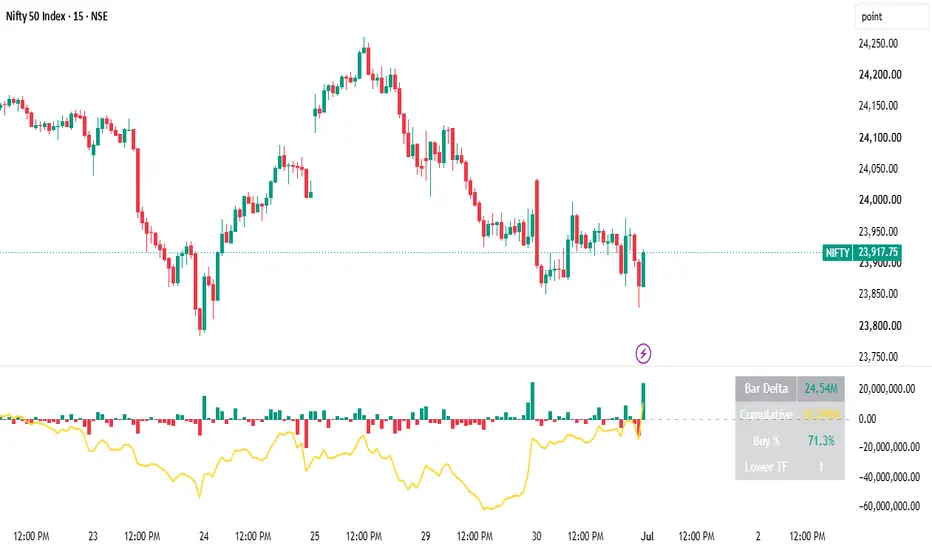
This indicator approximates buy-side versus sell-side trading pressure, commonly referred to as order flow delta or cumulative volume delta, using a tick-rule method applied to lower-timeframe price data. True bid and ask tick data is not available for most index and cash market symbols on this platform, so this script provides a volume-based directional approximation instead.
How it works:
For each bar on the chart, the script pulls a configurable lower-timeframe series of closes and volumes using request.security_lower_tf(). Each lower-timeframe close is compared to the prior lower-timeframe close: if price ticked up, that portion of volume is classified as buy-side; if price ticked down, it is classified as sell-side; unchanged ticks are split evenly, following standard tick-rule convention. These classified volumes are summed per chart bar to produce a per-bar delta value, plotted as a histogram, alongside a running cumulative delta line. If lower-timeframe data is unavailable, the script falls back to a close-position-within-range volume split as an approximation.
Notes and limitations:
This is a volume-based directional proxy, not real bid or ask order flow data. The currently forming bar's values can update intrabar as new lower-timeframe data arrives, which is expected behavior for any real-time order-flow style tool; once a bar closes, its value is fixed. This script does not generate trade signals and does not guarantee profitability. It is intended as a supplementary analytical tool and should be used alongside sound risk management. Past patterns in delta do not guarantee future price behavior.
How it works:
For each bar on the chart, the script pulls a configurable lower-timeframe series of closes and volumes using request.security_lower_tf(). Each lower-timeframe close is compared to the prior lower-timeframe close: if price ticked up, that portion of volume is classified as buy-side; if price ticked down, it is classified as sell-side; unchanged ticks are split evenly, following standard tick-rule convention. These classified volumes are summed per chart bar to produce a per-bar delta value, plotted as a histogram, alongside a running cumulative delta line. If lower-timeframe data is unavailable, the script falls back to a close-position-within-range volume split as an approximation.
Notes and limitations:
This is a volume-based directional proxy, not real bid or ask order flow data. The currently forming bar's values can update intrabar as new lower-timeframe data arrives, which is expected behavior for any real-time order-flow style tool; once a bar closes, its value is fixed. This script does not generate trade signals and does not guarantee profitability. It is intended as a supplementary analytical tool and should be used alongside sound risk management. Past patterns in delta do not guarantee future price behavior.
開源腳本
秉持TradingView一貫精神,這個腳本的創作者將其設為開源,以便交易者檢視並驗證其功能。向作者致敬!您可以免費使用此腳本,但請注意,重新發佈代碼需遵守我們的社群規範。

免責聲明
這些資訊和出版物並非旨在提供,也不構成TradingView提供或認可的任何形式的財務、投資、交易或其他類型的建議或推薦。請閱讀使用條款以了解更多資訊。
開源腳本
秉持TradingView一貫精神,這個腳本的創作者將其設為開源,以便交易者檢視並驗證其功能。向作者致敬!您可以免費使用此腳本,但請注意,重新發佈代碼需遵守我們的社群規範。
免責聲明
這些資訊和出版物並非旨在提供,也不構成TradingView提供或認可的任何形式的財務、投資、交易或其他類型的建議或推薦。請閱讀使用條款以了解更多資訊。