OPEN-SOURCE SCRIPT
Neon 4 Stack EMAs
What it does
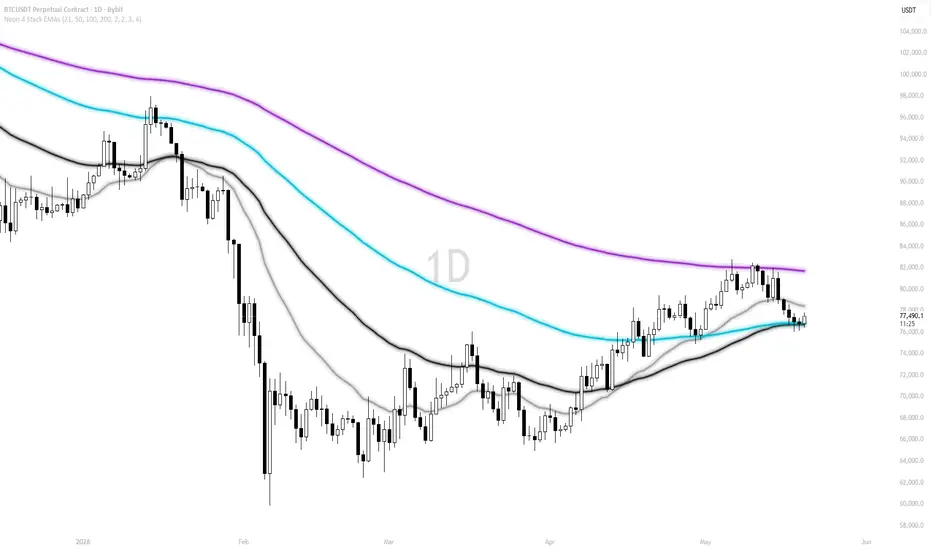
This tool plots four Exponential Moving Averages (EMAs) with a neon glow effect, designed to provide a clear multi-horizon structure on any symbol and timeframe. Each EMA is rendered with three glow layers plus a solid core line, creating a high-visibility aesthetic without sacrificing readability of price action.
How it works (method)
Each line is a standard EMA computed on the close price. The neon effect is achieved by stacking three transparent plots of decreasing width (outer, mid, inner) behind a solid core line, all sharing the same value — no visual offset or distortion.
Default periods and roles:
- EMA No 1 (21) – Grey: short-term reference
- EMA No 2 (50) – Black: intermediate reference
- EMA No 3 (100) – Cyan: medium-term reference
- EMA No 4 (200) – Purple: long-term bias and market context
Optional Crossover Color mode highlights whether EMA 1 is above or below EMA 2 (green/red). This is a visual aid only; it does not generate signals.
Originality & usefulness
The script combines a standard multi-horizon EMA stack with a neon glow rendering technique. It prioritizes clarity and control: fully customizable periods, colors, and thickness per EMA, with an optional crossover color mode. No opaque entry/exit logic is embedded.
Inputs & customization
- Periods: 21, 50, 100, 200 (all adjustable)
- Colors: fully customizable per EMA
- Thickness: set individually per EMA
- Crossover Color: optional visual mode for EMA 1 and EMA 2
- Glow layers: individually toggleable in the Style tab
Notes & limitations
- This script does not produce buy/sell signals or alerts.
- It is intended as a visual framework to support analysis.
- Always validate with your own rules, risk controls, and market conditions.
This tool plots four Exponential Moving Averages (EMAs) with a neon glow effect, designed to provide a clear multi-horizon structure on any symbol and timeframe. Each EMA is rendered with three glow layers plus a solid core line, creating a high-visibility aesthetic without sacrificing readability of price action.
How it works (method)
Each line is a standard EMA computed on the close price. The neon effect is achieved by stacking three transparent plots of decreasing width (outer, mid, inner) behind a solid core line, all sharing the same value — no visual offset or distortion.
Default periods and roles:
- EMA No 1 (21) – Grey: short-term reference
- EMA No 2 (50) – Black: intermediate reference
- EMA No 3 (100) – Cyan: medium-term reference
- EMA No 4 (200) – Purple: long-term bias and market context
Optional Crossover Color mode highlights whether EMA 1 is above or below EMA 2 (green/red). This is a visual aid only; it does not generate signals.
Originality & usefulness
The script combines a standard multi-horizon EMA stack with a neon glow rendering technique. It prioritizes clarity and control: fully customizable periods, colors, and thickness per EMA, with an optional crossover color mode. No opaque entry/exit logic is embedded.
Inputs & customization
- Periods: 21, 50, 100, 200 (all adjustable)
- Colors: fully customizable per EMA
- Thickness: set individually per EMA
- Crossover Color: optional visual mode for EMA 1 and EMA 2
- Glow layers: individually toggleable in the Style tab
Notes & limitations
- This script does not produce buy/sell signals or alerts.
- It is intended as a visual framework to support analysis.
- Always validate with your own rules, risk controls, and market conditions.
開源腳本
秉持TradingView一貫精神,這個腳本的創作者將其設為開源,以便交易者檢視並驗證其功能。向作者致敬!您可以免費使用此腳本,但請注意,重新發佈代碼需遵守我們的社群規範。

免責聲明
這些資訊和出版物並非旨在提供,也不構成TradingView提供或認可的任何形式的財務、投資、交易或其他類型的建議或推薦。請閱讀使用條款以了解更多資訊。
免責聲明
這些資訊和出版物並非旨在提供,也不構成TradingView提供或認可的任何形式的財務、投資、交易或其他類型的建議或推薦。請閱讀使用條款以了解更多資訊。