OPEN-SOURCE SCRIPT
HTF Levels
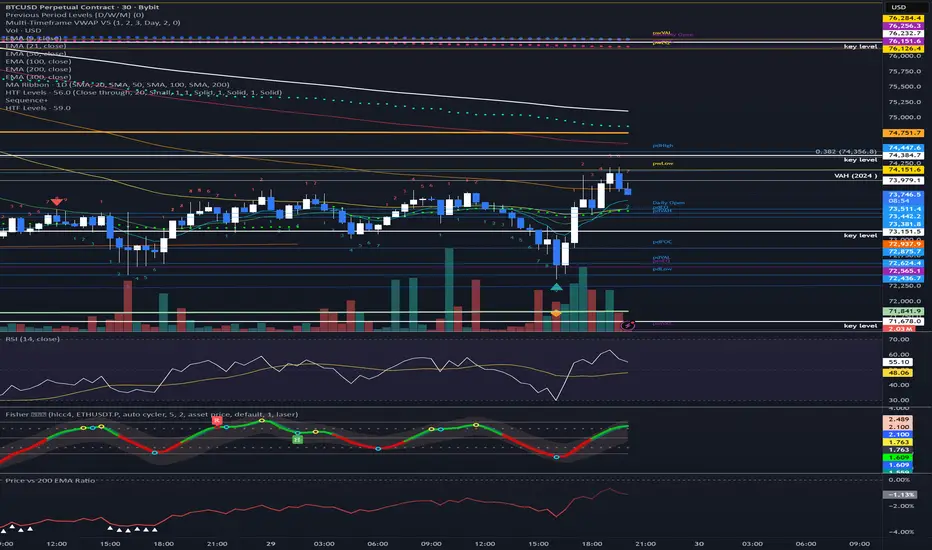
Plots higher-timeframe support/resistance from 2-bar reversals on the Daily, Weekly and Monthly charts. Each level is detected and pruned (removed on a close through it) over the full higher-timeframe history inside request.security, so coverage is independent of your chart timeframe. Active levels are drawn as horizontal lines anchored at the reversal, each with a clean text label showing the timeframe and price (e.g. "daily - 77,526.4"). Line and label colors are configurable per timeframe (Daily / Weekly / Monthly), with a dedup tolerance and "close through" vs "any touch" removal modes. Open-source: study and adapt freely.
開源腳本
秉持TradingView一貫精神,這個腳本的創作者將其設為開源,以便交易者檢視並驗證其功能。向作者致敬!您可以免費使用此腳本,但請注意,重新發佈代碼需遵守我們的社群規範。

免責聲明
這些資訊和出版物並非旨在提供,也不構成TradingView提供或認可的任何形式的財務、投資、交易或其他類型的建議或推薦。請閱讀使用條款以了解更多資訊。
免責聲明
這些資訊和出版物並非旨在提供,也不構成TradingView提供或認可的任何形式的財務、投資、交易或其他類型的建議或推薦。請閱讀使用條款以了解更多資訊。