Breadth Suite Pro
Breadth Suite Pro
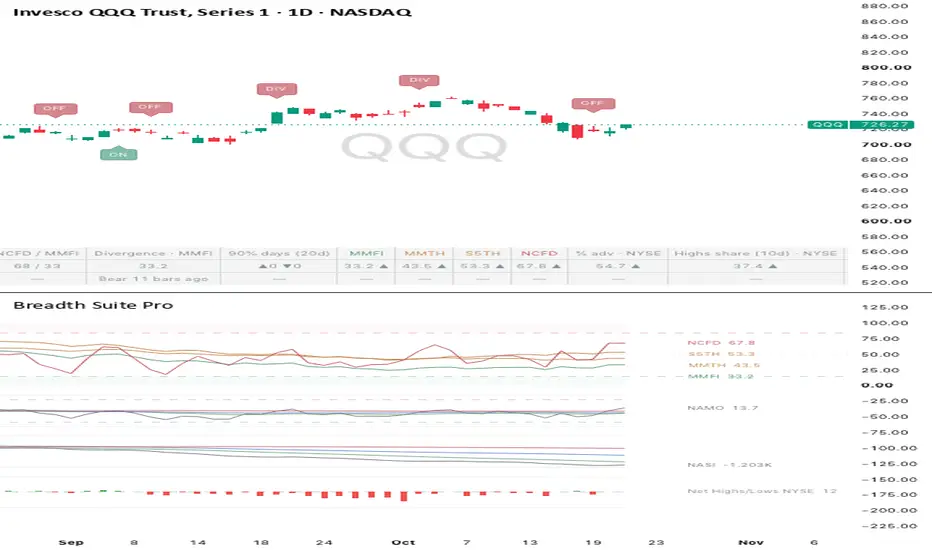
A single indicator that puts the common market breadth gauges in one subpanel, with a summary table on the price chart. Everything runs from one indicator slot, so it works on any TradingView plan.
I mostly use breadth to spot extremes, when the market gets stretched in one direction. Checking it usually meant flipping between several charts, so this pulls it into one place. Everything can be switched on or off, and the defaults are kept quiet.
LAYOUT
Subpanel, top to bottom:
1. A 0-100 area for percentage-based gauges
2. Up to three "lanes" below it for internals with their own scale (McClellan, Summation Index, A/D line, new highs/lows, put/call). Each lane scales to its own data, and its labels show the actual values. The subpanel's right-hand axis applies to the 0-100 area only.
Table: shown on the price chart (bottom center, horizontal by default). Its rows are chosen separately from what's plotted in the subpanel.
WHAT IT MEASURES
% of stocks above moving averages (0-100):
- All US stocks: MMTW (20d), MMFI (50d), MMOH (100d), MMOF (150d), MMTH (200d)
- S&P 500: S5TW, S5FI, S5OH, S5TH
- Nasdaq-100: NDTW, NDFI, NDTH
- Short-term 5-day: MMFD, S5FD, NDFD, NCFD (Nasdaq Composite), DIFD (Dow 30), R2FD (Russell 2000)
Default levels are 85/15. Each ticker can also use its own levels. NCFD can be drawn as a line or as daily OHLC bars (the "FOMO style" view).
0-100 internals (NYSE and Nasdaq):
- % advancing = advances / (advances + declines) x 100
- % up volume = up volume / (up volume + down volume) x 100
- Highs share = new highs / (new highs + new lows) x 100, using 10-day totals
Lanes:
- McClellan Oscillator (NYMO / NAMO): ratio-adjusted by default, the same method StockCharts uses. Each day's (advances - declines) / (advances + declines) x 1000, then the 19-day EMA minus the 39-day EMA. A traditional (raw A-D) option is included.
- McClellan Summation Index (NYSI / NASI): running total of the oscillator
- A/D Line: cumulative advances minus declines
- Net New Highs: new highs minus new lows, shown as green/red columns
- New Highs vs Lows: new highs as columns above zero and new lows below, with the net as a line
- CBOE Put/Call ratio: total or equity, with optional smoothing
Line lanes get optional moving averages (default EMA 20, SMA 50, SMA 200, as on StockCharts NAMO/NASI charts).
SWING-TRADING READINGS
Shown in the table, marked on the price chart, and included in alerts.
- Regime (0-4): one point each for S5TH above 50, MMFI above 50, NASI above its 20 EMA, and NYSE new highs above new lows. 3-4 = Risk-on, 2 = Mixed, 0-1 = Risk-off.
- Zweig Breadth Thrust: the 10-day EMA of NYSE advances / (advances + declines) rises from below 40% to above 61.5% within 10 days. Rare by design.
- Washout / overheat: a short-term gauge (NCFD by default, 15/85) and an intermediate gauge (MMFI by default, 20/80) both at an extreme at the same time
- Divergence: the chart makes a new 20-bar high (or low) while MMFI sits at least 5 points below its own 20-bar high (or above its low)
- 90% days: NYSE days where up volume is at least 90% (or at most 10%) of total volume, counted over 20 days
The table can also show a 5-bar direction arrow for each reading and an optional 1-year percentile rank.
SIGNALS AND ALERTS
- Level crosses fire once when a gauge crosses into its zone, on bar close by default (no repainting). Red = crossing above the high level, green = crossing below the low level. Direction can be flipped for metrics where that makes more sense (put/call, net new highs, MA crosses).
- Price-chart arrows for level crosses are off by default. Event markers (ZBT, WASH, HEAT, DIV, ON, OFF) are on.
- Alerts: use the RED/GREEN conditions for level crosses, or "Any alert() function call" for a message that lists exactly what triggered, including the swing-trading events.
DEFAULTS
Subpanel: MMFI, MMTH, S5TH and NCFD, with NAMO, NASI and NYSE net new highs in the lanes.
Table: regime, Zweig thrust, washout/overheat, divergence, 90% days, the plotted tickers, % advancing (NYSE), highs share (NYSE), NAMO, NASI and equity put/call.
NOTES
- Built for daily charts. Advance/decline, volume, new high/low and put/call data are calculated on the daily timeframe by default.
- Breadth readings are market-wide and don't change with the chart symbol. Divergence compares the gauge with the chart's own price, so it's most useful on a broad index or ETF such as SPY or QQQ.
- The Summation Index is a running total, so its level depends on how much history is loaded. Use the NYSI/NASI offset inputs to line it up with StockCharts: enter the StockCharts value minus this indicator's value for the same day.
- Lanes are drawn for the most recent 250 bars by default (adjustable up to 2,000).
- Data comes from TradingView's built-in exchange breadth symbols (INDEX and USI). If a symbol has no data on your plan or for a given date, that row shows n/a.
- All levels are starting points, not tested trading signals. Adjust them to your own market and history.
The McClellan Oscillator and Summation Index were developed by Sherman and Marian McClellan, and the Breadth Thrust by Martin Zweig.
For informational and educational purposes only. Not financial advice.
A single indicator that puts the common market breadth gauges in one subpanel, with a summary table on the price chart. Everything runs from one indicator slot, so it works on any TradingView plan.
I mostly use breadth to spot extremes, when the market gets stretched in one direction. Checking it usually meant flipping between several charts, so this pulls it into one place. Everything can be switched on or off, and the defaults are kept quiet.
LAYOUT
Subpanel, top to bottom:
1. A 0-100 area for percentage-based gauges
2. Up to three "lanes" below it for internals with their own scale (McClellan, Summation Index, A/D line, new highs/lows, put/call). Each lane scales to its own data, and its labels show the actual values. The subpanel's right-hand axis applies to the 0-100 area only.
Table: shown on the price chart (bottom center, horizontal by default). Its rows are chosen separately from what's plotted in the subpanel.
WHAT IT MEASURES
% of stocks above moving averages (0-100):
- All US stocks: MMTW (20d), MMFI (50d), MMOH (100d), MMOF (150d), MMTH (200d)
- S&P 500: S5TW, S5FI, S5OH, S5TH
- Nasdaq-100: NDTW, NDFI, NDTH
- Short-term 5-day: MMFD, S5FD, NDFD, NCFD (Nasdaq Composite), DIFD (Dow 30), R2FD (Russell 2000)
Default levels are 85/15. Each ticker can also use its own levels. NCFD can be drawn as a line or as daily OHLC bars (the "FOMO style" view).
0-100 internals (NYSE and Nasdaq):
- % advancing = advances / (advances + declines) x 100
- % up volume = up volume / (up volume + down volume) x 100
- Highs share = new highs / (new highs + new lows) x 100, using 10-day totals
Lanes:
- McClellan Oscillator (NYMO / NAMO): ratio-adjusted by default, the same method StockCharts uses. Each day's (advances - declines) / (advances + declines) x 1000, then the 19-day EMA minus the 39-day EMA. A traditional (raw A-D) option is included.
- McClellan Summation Index (NYSI / NASI): running total of the oscillator
- A/D Line: cumulative advances minus declines
- Net New Highs: new highs minus new lows, shown as green/red columns
- New Highs vs Lows: new highs as columns above zero and new lows below, with the net as a line
- CBOE Put/Call ratio: total or equity, with optional smoothing
Line lanes get optional moving averages (default EMA 20, SMA 50, SMA 200, as on StockCharts NAMO/NASI charts).
SWING-TRADING READINGS
Shown in the table, marked on the price chart, and included in alerts.
- Regime (0-4): one point each for S5TH above 50, MMFI above 50, NASI above its 20 EMA, and NYSE new highs above new lows. 3-4 = Risk-on, 2 = Mixed, 0-1 = Risk-off.
- Zweig Breadth Thrust: the 10-day EMA of NYSE advances / (advances + declines) rises from below 40% to above 61.5% within 10 days. Rare by design.
- Washout / overheat: a short-term gauge (NCFD by default, 15/85) and an intermediate gauge (MMFI by default, 20/80) both at an extreme at the same time
- Divergence: the chart makes a new 20-bar high (or low) while MMFI sits at least 5 points below its own 20-bar high (or above its low)
- 90% days: NYSE days where up volume is at least 90% (or at most 10%) of total volume, counted over 20 days
The table can also show a 5-bar direction arrow for each reading and an optional 1-year percentile rank.
SIGNALS AND ALERTS
- Level crosses fire once when a gauge crosses into its zone, on bar close by default (no repainting). Red = crossing above the high level, green = crossing below the low level. Direction can be flipped for metrics where that makes more sense (put/call, net new highs, MA crosses).
- Price-chart arrows for level crosses are off by default. Event markers (ZBT, WASH, HEAT, DIV, ON, OFF) are on.
- Alerts: use the RED/GREEN conditions for level crosses, or "Any alert() function call" for a message that lists exactly what triggered, including the swing-trading events.
DEFAULTS
Subpanel: MMFI, MMTH, S5TH and NCFD, with NAMO, NASI and NYSE net new highs in the lanes.
Table: regime, Zweig thrust, washout/overheat, divergence, 90% days, the plotted tickers, % advancing (NYSE), highs share (NYSE), NAMO, NASI and equity put/call.
NOTES
- Built for daily charts. Advance/decline, volume, new high/low and put/call data are calculated on the daily timeframe by default.
- Breadth readings are market-wide and don't change with the chart symbol. Divergence compares the gauge with the chart's own price, so it's most useful on a broad index or ETF such as SPY or QQQ.
- The Summation Index is a running total, so its level depends on how much history is loaded. Use the NYSI/NASI offset inputs to line it up with StockCharts: enter the StockCharts value minus this indicator's value for the same day.
- Lanes are drawn for the most recent 250 bars by default (adjustable up to 2,000).
- Data comes from TradingView's built-in exchange breadth symbols (INDEX and USI). If a symbol has no data on your plan or for a given date, that row shows n/a.
- All levels are starting points, not tested trading signals. Adjust them to your own market and history.
The McClellan Oscillator and Summation Index were developed by Sherman and Marian McClellan, and the Breadth Thrust by Martin Zweig.
For informational and educational purposes only. Not financial advice.

免責聲明
這些資訊和出版物並非旨在提供,也不構成TradingView提供或認可的任何形式的財務、投資、交易或其他類型的建議或推薦。請閱讀使用條款以了解更多資訊。
免責聲明
這些資訊和出版物並非旨在提供,也不構成TradingView提供或認可的任何形式的財務、投資、交易或其他類型的建議或推薦。請閱讀使用條款以了解更多資訊。