Gap Fill Statistics
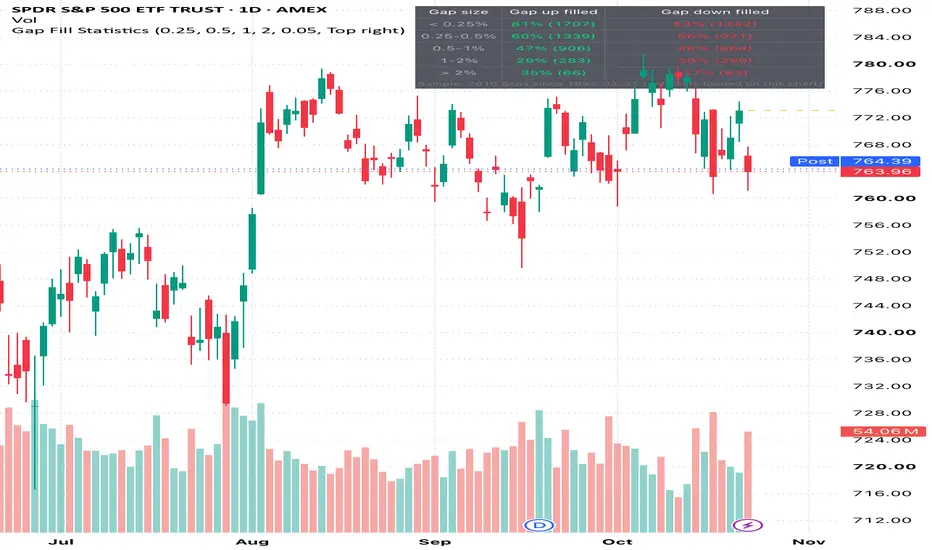
Gap Fill Statistics measures how often an opening gap trades back to the prior session's close on the same day, split by gap direction and gap size.
How it works
- A gap is today's open versus the previous session's close, in percent.
- A gap up counts as filled if price trades at or below the prior close before the session ends; a gap down counts as filled if price trades at or above it.
- Gaps are grouped into five size buckets (editable). Each cell shows the fill rate and, in brackets, how many gaps were counted.
- A dashed line marks today's gap-fill level (the prior close).
Settings
- Bucket bounds in percent, a minimum gap size to ignore noise, the gap-fill line on/off, and the table position.
Notes
- The statistics only cover the bars loaded on your chart. The footer shows the sample size and its start date, so you can judge how much history sits behind each number. The daily chart usually gives the longest sample.
- Use regular trading hours. With extended hours on, the "prior close" becomes the last after-hours print.
- Historical fill rates describe the past; they are not a forecast or a trading signal.
Open source under MPL 2.0.
How it works
- A gap is today's open versus the previous session's close, in percent.
- A gap up counts as filled if price trades at or below the prior close before the session ends; a gap down counts as filled if price trades at or above it.
- Gaps are grouped into five size buckets (editable). Each cell shows the fill rate and, in brackets, how many gaps were counted.
- A dashed line marks today's gap-fill level (the prior close).
Settings
- Bucket bounds in percent, a minimum gap size to ignore noise, the gap-fill line on/off, and the table position.
Notes
- The statistics only cover the bars loaded on your chart. The footer shows the sample size and its start date, so you can judge how much history sits behind each number. The daily chart usually gives the longest sample.
- Use regular trading hours. With extended hours on, the "prior close" becomes the last after-hours print.
- Historical fill rates describe the past; they are not a forecast or a trading signal.
Open source under MPL 2.0.

免責聲明
這些資訊和出版物並非旨在提供,也不構成TradingView提供或認可的任何形式的財務、投資、交易或其他類型的建議或推薦。請閱讀使用條款以了解更多資訊。