OPEN-SOURCE SCRIPT
Price change area
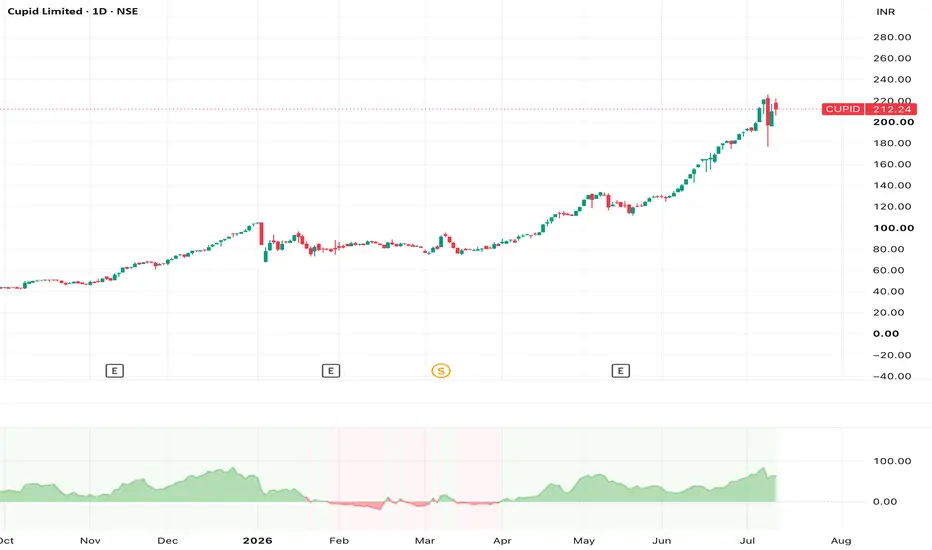
This indicator visualizes how much the price has changed over a configurable lookback period, displayed as a continuous area in a separate pane.
Features
• Two calculation modes:
• Exact % change – compares today’s close to the close exactly y bars ago.
• Max % change – shows the largest % move from an extreme (lowest or highest close) in the last y bars to today’s close.
• Configurable lookback: set the number of bars y (default: 30).
• Y-axis scale options:
• Ratio – displays values like 0.33 , -0.20 (i.e., +33%, −20%).
• Percent – displays values like 33.3 , -20.0 .
• Color-coded area:
• Green for positive change (price up over the lookback).
• Red for negative change (price down over the lookback).
• Zero line = no change.
How it works
• Uses closing prices only.
• For each bar, computes:
• Exact mode:
• Max mode:
• Finds lowest and highest close in the last y bars.
• Calculates up and down ratios from those extremes to today’s close.
• Plots the one with the larger absolute deviation from 1.
• Plots (ratio − 1) (or (ratio − 1) × 100 in Percent mode) as a filled area around the zero line.
Use cases
• Quickly spot strong up/down moves over a chosen period.
• Study historical volatility and momentum in terms of % change.
• Compare how different stocks or timeframes behave over similar lookback windows.
Inputs
• Lookback bars (y): number of bars to consider (default 30).
• Calculation Mode: “Exact % change” or “Max % change”.
• Y-Axis Scale: “Ratio” or “Percent”.
Features
• Two calculation modes:
• Exact % change – compares today’s close to the close exactly y bars ago.
• Max % change – shows the largest % move from an extreme (lowest or highest close) in the last y bars to today’s close.
• Configurable lookback: set the number of bars y (default: 30).
• Y-axis scale options:
• Ratio – displays values like 0.33 , -0.20 (i.e., +33%, −20%).
• Percent – displays values like 33.3 , -20.0 .
• Color-coded area:
• Green for positive change (price up over the lookback).
• Red for negative change (price down over the lookback).
• Zero line = no change.
How it works
• Uses closing prices only.
• For each bar, computes:
• Exact mode:
• Max mode:
• Finds lowest and highest close in the last y bars.
• Calculates up and down ratios from those extremes to today’s close.
• Plots the one with the larger absolute deviation from 1.
• Plots (ratio − 1) (or (ratio − 1) × 100 in Percent mode) as a filled area around the zero line.
Use cases
• Quickly spot strong up/down moves over a chosen period.
• Study historical volatility and momentum in terms of % change.
• Compare how different stocks or timeframes behave over similar lookback windows.
Inputs
• Lookback bars (y): number of bars to consider (default 30).
• Calculation Mode: “Exact % change” or “Max % change”.
• Y-Axis Scale: “Ratio” or “Percent”.
開源腳本
秉持TradingView一貫精神,這個腳本的創作者將其設為開源,以便交易者檢視並驗證其功能。向作者致敬!您可以免費使用此腳本,但請注意,重新發佈代碼需遵守我們的社群規範。

免責聲明
這些資訊和出版物並非旨在提供,也不構成TradingView提供或認可的任何形式的財務、投資、交易或其他類型的建議或推薦。請閱讀使用條款以了解更多資訊。
免責聲明
這些資訊和出版物並非旨在提供,也不構成TradingView提供或認可的任何形式的財務、投資、交易或其他類型的建議或推薦。請閱讀使用條款以了解更多資訊。